
The stock market and tech stocks in particular have been under the pump recently. A lot of traders have been wondering when we will find the bottom.
FB has been particular hard hit due to privacy issues, I wrote about three different trade ideas here.
Stocks rallied strongly on Thursday, so my question is, was it possible to predict the big rally?
My argument is yes, at least with some degree of certainty. Divergence is one of my favorite indicators to watch out for. It doesn’t happen that often on the major indexes, but when it does, it can pay off handsomely.
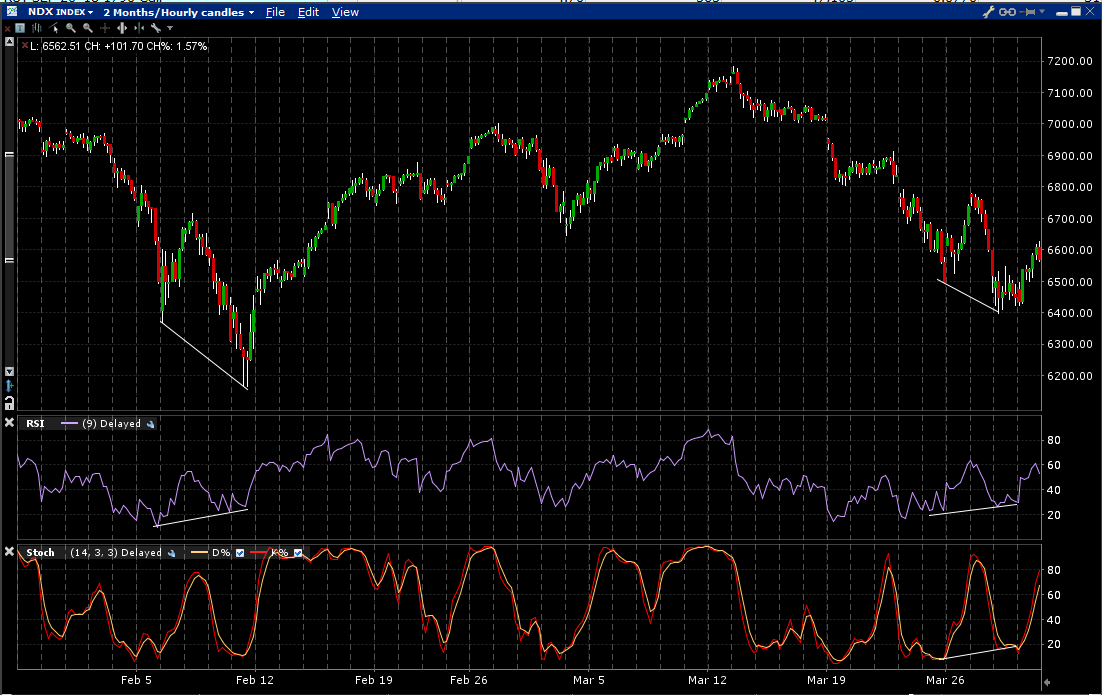
On the chart below, you can see two examples of positive divergence in the Nasdaq.
The first occurred between Feb 6th and Feb 9th. The index made a lower low, but that was not confirmed but the momentum indicator. I.e. the strength of the selling was waning. Sure enough, NDX went on to rally 16% from that point.
We then see a similar divergence between March 23rd and March 28th when the Nasdaq made a new low, but again, it was not confirmed by the momentum. Sellers were losing control and buyers were stepping in.
From there we rallied strongly on Thursday. The close was a little weak, but my guess is that was because traders didn’t want to take too much exposure over the long weekend.
Time will tell if this latest divergence will see gains similar to mid-Feb, there are certainly some short-term hurdles to overcome. The positive divergence would become void if RSI breaks below the trendline.
Keep an eye out for divergence in your trading and it will hold you in good stead.


Leave A Comment