
Mid-Week Report – March 14, 2018

VIX has risen above its 50-day Moving Average at 16.71, giving the VIX a probable buy signal. The Cycles Model now indicates that the rally may continue for up to two more weeks.
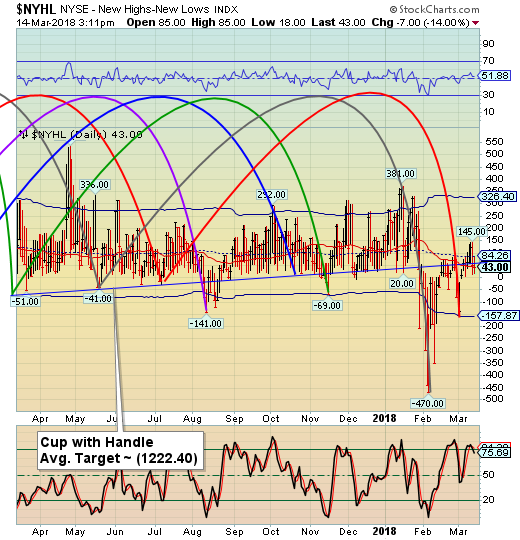
— The NYSE Hi-Lo Index closed just beneath its trendline at 56.00, giving it a sell signal. A close in negative territory confirms the signal.
(ZeroHedge) Over the weekend, when we noted the ongoing blow out in the Libor-OIS spread, we asked whether a dollar funding crisis is emerging, now that this traditional indicator of monetary tightness and systemic credit stress has blown out to levels last seen during the European sovereign debt crisis of 2011.
One day later, Bank of America’s rates strategist Mark Cabana used the same chart as his “chart of the day”, noting that “the 3-month USD LIBOR-OIS spread recently widened sharply to levels not seen since the European peripheral crisis in 2011-12.”

— SPX has challenged the 50-day Moving Average at 2747.08 today, closing near the low. The SPX goes on a confirmed sell signal beneath the 50-day. Yesterday the SPX was repulsed at the upper Diagonal trendline in a second inverted Master Cycle. While highly unusual, the implication is that there may be another test of the low in a matter of days.
(Reuters) – The Dow Jones Industrial Average fell more than 250 points, or 1 percent, on Wednesday as industrial stocks tumbled over growing fears of a trade war with China after President Donald Trump sought to impose fresh tariffs.
Trump is looking to levy tariffs on up to $60 billion of Chinese imports, targeting the technology, telecom and apparel sectors, sources told Reuters on Tuesday.
The Trump administration is pressing China to cut its trade surplus with the United States by $100 billion, the White House said Wednesday.
The S&P industrial stocks were again the worst hit, falling 1.02 percent. Boeing tumbled 3.5 percent, leading the losers and wiping off 70 points from the Dow Industrials.
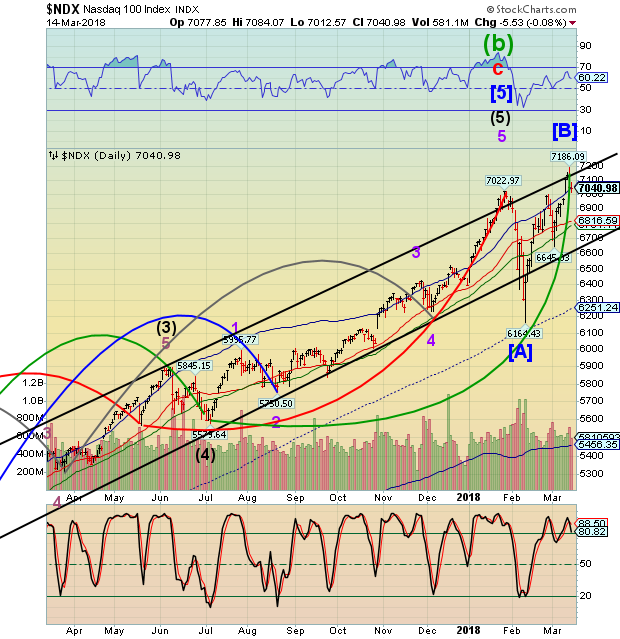
— NDX closed beneath its Cycle Top at 7046.13 this afternoon after challenging the upper Diagonal trendline in a Master Cycle (inverted) high. This move puts the NDX on an aggressive sell signal. A decline beneath Intermediate-term support at 6816.59 and the nearby 50-day Moving Average at 6971.11 confirms the sell. However, the implications of an inverted Cycle are the same as the January 26 high.
(ZeroHedge) The Last Breakout
As stated, breakouts are indeed bullish and suggest higher prices in the short-term. This time is likely no different. However, breakouts to new highs are not ALWAYS as bullish as they seem in the heat of the moment. A quick glance at history shows there is always a “last” break out of every advance.
As a whole, the group is still outperforming the market. But upon closer inspection, there’s a performance gap between the index’s winners and losers not seen since 2015.

— The High Yield Bond Index also appears to have had an inverted Master Cycle. Until now, the high yield Cycles have duplicated the equities Cycles. However, the message in high yield appears ominous. A decline equal to the first may take MUT to its Cycle Bottom.
(Forbes) High yield bonds, also known as “junk” bonds, have always had an identity crisis. They show up in our portfolio reviews under the category of “bonds,” but in reality, they move more closely with the stock market than the bond market. They’re an investment that has some characteristics of bonds and some of stocks – and may be an important part of your portfolio.
What are junk bonds? Like all bonds, they’re long-term IOUs from companies to investors. Just as individuals with poor credit have to pay high-interest rates, so do companies. And when a company’s credit rating is low enough, Wall Street calls those IOUs junk bonds – or, more genteelly, high yield bonds. Sometimes distressed companies issue junk bonds, but sometimes the issuers are companies on the rebound from hard times, such as telecommunications companies like Sprint or hospital operator HCA.


Leave A Comment