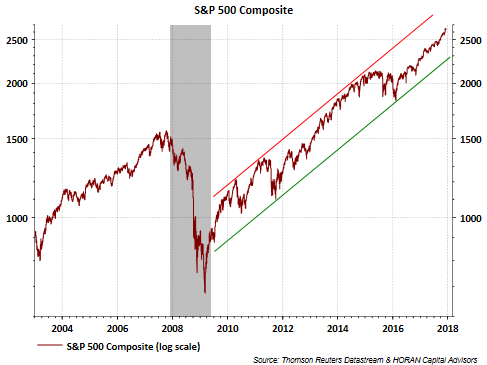
It seems like an eternity since the S&P 500 Index experienced a pullback of more than 5%. In fact, the last greater than 5% pullback occurred over a year ago during the period of June 8, 2016 to June 27, 2016. This lack of downside volatility has taken place during a nearly uninterrupted increase in the market that began in February last year. Additionally, the market advance since the end of the financial crisis looks remarkable as well. Little or no downside volatility might be understandable if the equity markets were trading sideways this entire time; however, that has not been the case as can be seen below.

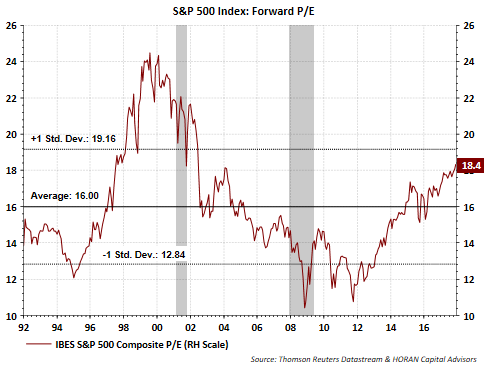
Not surprisingly, the market’s uptrend or return has not only been driven by earnings growth but by expansion in the market’s P/E multiple. The below chart shows the S&P 500 Index forward P/E approaching the +1 standard deviation level, yet below the technology bubble peak of nearly 25 times earnings. Stocks do trade at higher multiples in lower interest rate environments.
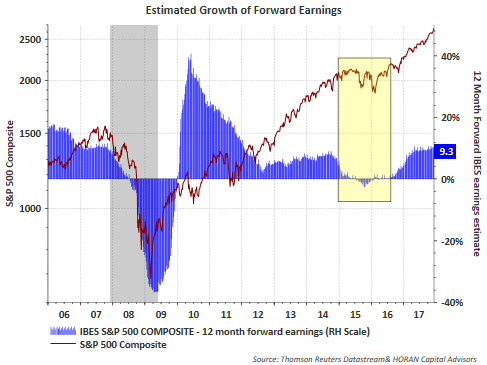
This expansion in the market multiple will not continue unabated and I believe earnings growth will be a key driver of further market returns going forward. Growth in earnings is anticipated with the forward earnings estimate growing at a near double digit rate.
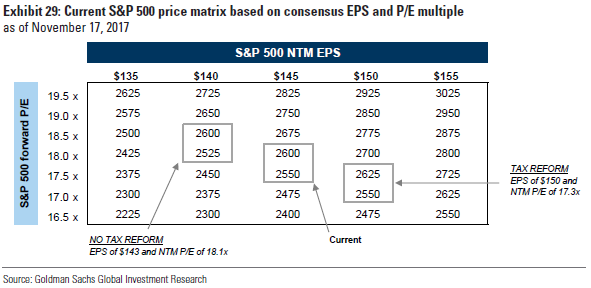
Also supporting a potentially faster earnings growth picture is the tax reform legislation working its way through Congress. Goldman Sachs is estimating tax reform could add 5% to the next twelve months earnings expectations for the S&P 500 Index. The additional earnings retained by companies would serve to reduce the market’s P/E multiple as well. Importantly, even without the benefit of tax reform, the forward P/E multiple is expected to remain level at 18 times earnings when looking out twelve months as the rate of earnings growth supports a higher market value.
The lack of market volatility and the market’s strong return since early 2016 has many investors anticipating a pullback that exceeds the minor dips currently taking place. Consequently, individual investors as well as institutional ones are not expressing overly bullish equity sentiment. Sentiment measures are contrarian ones and this lack of bullishness is generally associated with higher equity prices in the future and not lower ones. Below is the the recent NAAIM Exposure Index level and a summary of the American Association of Individual Investors Sentiment Survey. Neither one expressing excessive optimism.


Leave A Comment