International trade disrupts the economic patterns that would otherwise exist, and both the benefits and costs of trade flow from such disruptions. The IMF, World Bank, and World Trade Organization have come together to write “Making Trade an Engine of Growth for All: The Case for Trade and for Policies to Facilitate Adjustment,” which was published for an international meeting held March 22-23 in Germany.
A lot of the report is about gains from trade, public attitudes toward trade, the size of barriers to trade, and possibilities for reducing barriers to trade through negotiations. Here, I’ll focus on some points related to the costs of trade disruption and potential policies to address it.
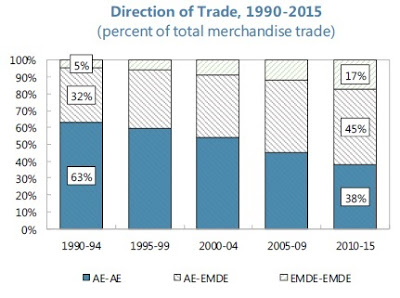
Patterns of global trade in manufacturing have changed substantially since the 1990s. This figure shows that in from 1990-94, 63% of all merchandise trade as between advanced economies. By the 2010-2015 time period, this had dropped to 38%, while 45% of merchandise trade was between advanced economies (AE) and “emerging markets and developing economies” (EMDE), and the remaining 17% was between emerging market and developing economies.

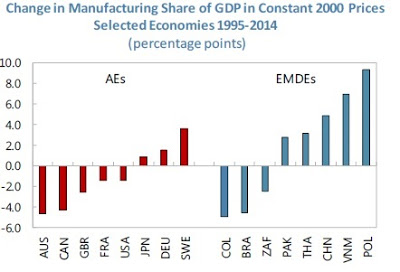
The share of GDP related to manufacturing shifted during this time as well, but perhaps it wasn’t always advanced economist that saw declines nor always emerging market and developing economies that saw raises. For example, this figure shows that the manufacturing share of GDP decline in the US from 1995-2014, but the decline was smaller than in Canada or the UK–and Germany saw an increase in manufacturing as a share of GDP. Among the emerging market and developing economies, China saw a rise in manufacturing as a share of GDP during this time, along with Thailand, Vietnam, and Poland, but Brazil and South Africa (abbreviated ZAF) saw declines in manufacturing as a share of GDP during this time.
The report notes that the freedom to import from the world economy is a benefit to consumers: in particular, cheap imports are a huge benefit for those with lower incomes. The report offers a figure drawn from a recent paper by Pablo D. Fajgelbaum and Amit K. Khandelwal, “Measuring the Unequal Gains from Trade,” Quarterly Journal of Economics, 2016, 131: 3, pp. 1113-1180. The horizontal axis shows how much the real income (that is, the buying power of income) would fall without a trade for the lowest decile by income, while the vertical axis shows how much the real income of the top decile would fall. As the graph shows, for all 40 countries in the study, the loss of income for the poor would be greater than for the rich: for example, in the US cutting off trade would reduce the real income of the bottom decile by almost 70%, but of the top decile by less than 5%.


Leave A Comment