The Q1 earnings season is now effectively behind us, as the Retail sector earnings reports are mostly out now. With results from 480 S&P 500 already out and another 15 index reports reporting results this week, we will have seen Q1 results from 495 index members by the end of this week. Costco (COST – Analyst Report), Best Buy (BBY – Analyst Report) and AutoZone (AZO – Analyst Report) are this week’s notable earnings releases.
The Q1 earnings season provided further confirmation of the all-around weak earnings picture. While an above average proportion of companies were able to beat consensus expectations, the growth challenge proved widespread and not just a function of the beleaguered Energy sector. Earnings growth remained in negative territory for the 4th quarter in a row, with the trend expected to continue in the current period as well. On the positive side, the dollar drag started fading and the magnitude of negative revisions for the current period turned out to be less severe relatively to other recent quarters.
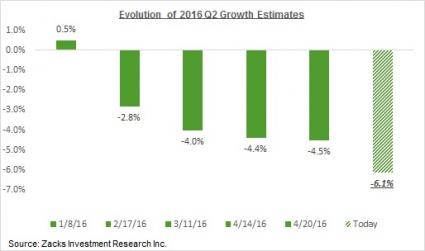
Estimates for Q2 have faithfully followed the well-trodden path of previous quarters, as the chart below shows.

As negative as this revisions trend looks, it is nevertheless an improvement over what we had seen in the comparable period in the preceding earnings cycle. The improved commodity-price backdrop and the reduced dollar drag are some of the more plausible explanations for this development. But it is also likely that Q2 estimates had already fallen enough at the time when Q1 estimates were coming down and there is simply not that much need for further downward adjustments.
Whatever the reason for the lower negative revisions trend for Q2 estimates, it is nevertheless a potentially positive development, particularly if sustained over the coming months. We will have to wait till July to get a better read on this development after companies start reporting June quarter results and guide towards Q3 estimates. Current estimates for Q3 are showing essentially flat growth from the year-earlier level.
The chart below shows current quarterly earnings growth expectations for the index in 2016 Q1 and the following four quarters contrasted with actual declines in the preceding three quarters. As you can see, growth is expected to be negative in 2016 Q2 and barely in positive territory in the following quarter.

Q1 is on track to be the 4th quarter in a row of earnings declines for the index. But as you can see in the chart above, this trend of earnings declines is expected to continue into the second quarter and most likely into the following one as well.
Retail Sector’s Q1 Scorecard
At this stage in the reporting cycle, we have seen Q1 results from 83.7% of the retailers in the S&P 500 index. Total earnings for these retailers are up +2.5% from the same period last year on +5.6% higher revenues, with 69.4% beating EPS estimates and 50% beating revenue expectations.
Positive surprises are more numerous even for the Retail sector, as you can see in the right-hand side chart below.
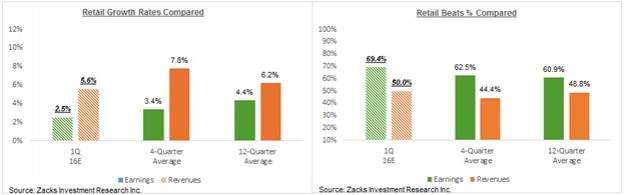
The growth picture emerging from the left-hand side chart doesn’t look so bad, with earnings growth in positive territory and revenue gains tracking above historical periods. But a lot of that momentum is a function of non-department store results that came out earlier in this cycle, particularly from online vendors like Amazon (AMZN). The sector’s growth comparisons don’t look so good on an ex-Amazon basis, as the right-hand side chart below does.

Q1 Earnings Scorecard (As of Friday, May 20th)
We now have Q1 results from 480 S&P 500 members or 96% of the index’s total membership. Total earnings for these index members are down -6.9% from the same period last year on -1.1% lower revenues, with 70.4% beating EPS estimates and 55.6% beating revenue estimates. The percentage of companies that are able to beat both EPS and revenue estimates is tracking 45.6% at this stage.
The table below shows the current scorecard for these companies

As you can see (columns 2 & 3), the Q1 earnings season has come to an end for 11 of the 16 Zacks sectors, while another 4 sectors are past the 90% mark in their reporting tallies. The Retail sector has the most still to come at this stage with only 83.7% reported so far.


Leave A Comment