
With the stock up 21.5% over the last three months, investors may be tempted to sell their shares of Domino’s Pizza, Inc. (NYSE: DPZ). In this article, I am going to calculate the fair value of Domino’s Pizza by forecasting its future cash flows and discounting them back to today’s value. Value investors may find the results from my analysis surprising.
DCF Methodology
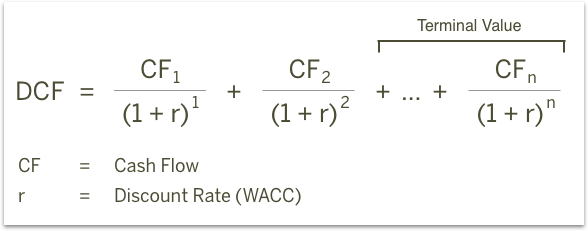
The basic philosophy behind a DCF analysis is that the intrinsic value of a company is equal to the future cash flows of that company, discounted back to present value. The general formula is provided below. The intrinsic value is considered the actual value or “true value” of an asset based on an individual’s underlying expectations and assumptions.
Cash flows into the firm in the form of revenue as the company sells its products and services, and cash flows out as it pays its cash operating expenses such as salaries or taxes (taxes are part of the definition for cash operating expenses for purposes of defining free cash flow, even though taxes aren’t generally considered a part of operating income). With the leftover cash, the firm will make short-term net investments in working capital (an example would be inventory and receivables) and longer-term investments in property, plant and equipment. The cash that remains is available to pay out to the firm’s investors: bondholders and common shareholders.
I will take you through my own expectations for Domino’s Pizza as well as explain how I arrived at certain assumptions. The full analysis was completed on Tuesday, March 27. An updated analysis using real-time data can be viewed in your web browser at finbox.io’s Domino’s Pizza DCF analysis page. The steps involved in the valuation are:
1. Forecast Free Cash Flows
2. Select a discount rate
3. Estimate a terminal value
4. Calculate the equity value
Step 1: Forecast Free Cash Flows
The key assumptions that have the greatest impact on cash flow projections are typically related to growth, profit margin and investments in the business. The analysis starts at the top of the income statement by creating a forecast for revenue and then works its way down to net operating profit after tax (NOPAT), as shown below.
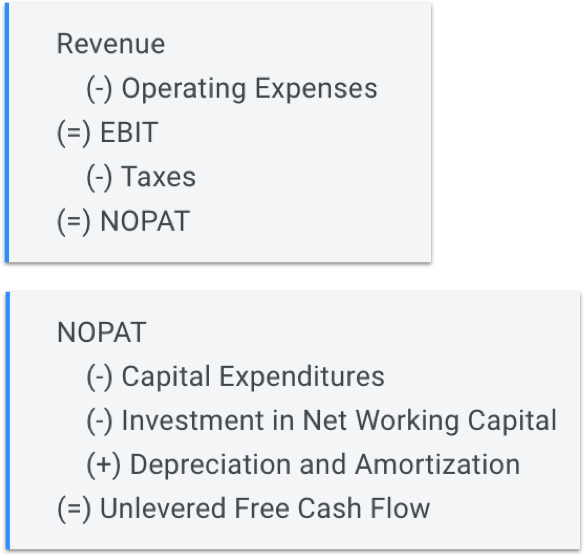
From NOPAT, deduct cash outflows like capital expenditures and investments in net working capital and add back non-cash expenses from the income statement such as depreciation and amortization to calculate the unlevered free cash flow forecast (shown above).
Create A Revenue Forecast
When available, the finbox.io’s pre-built models use analyst forecasts as the starting assumptions. To forecast revenue, analysts gather data about the company, its customers and the state of the industry. I typically review the analysts’ forecast and modify the growth rates based on historical performance, news and other insights gathered from competitors. Note that if a company only has a small number of analysts giving projections, the consensus forecast tends to not be as reliable as companies that have several analysts’ estimates. Another check for reliability is to analyze the range of estimates. If the range is really wide, it may be less accurate.


Leave A Comment