
EUR/USD
4 hour
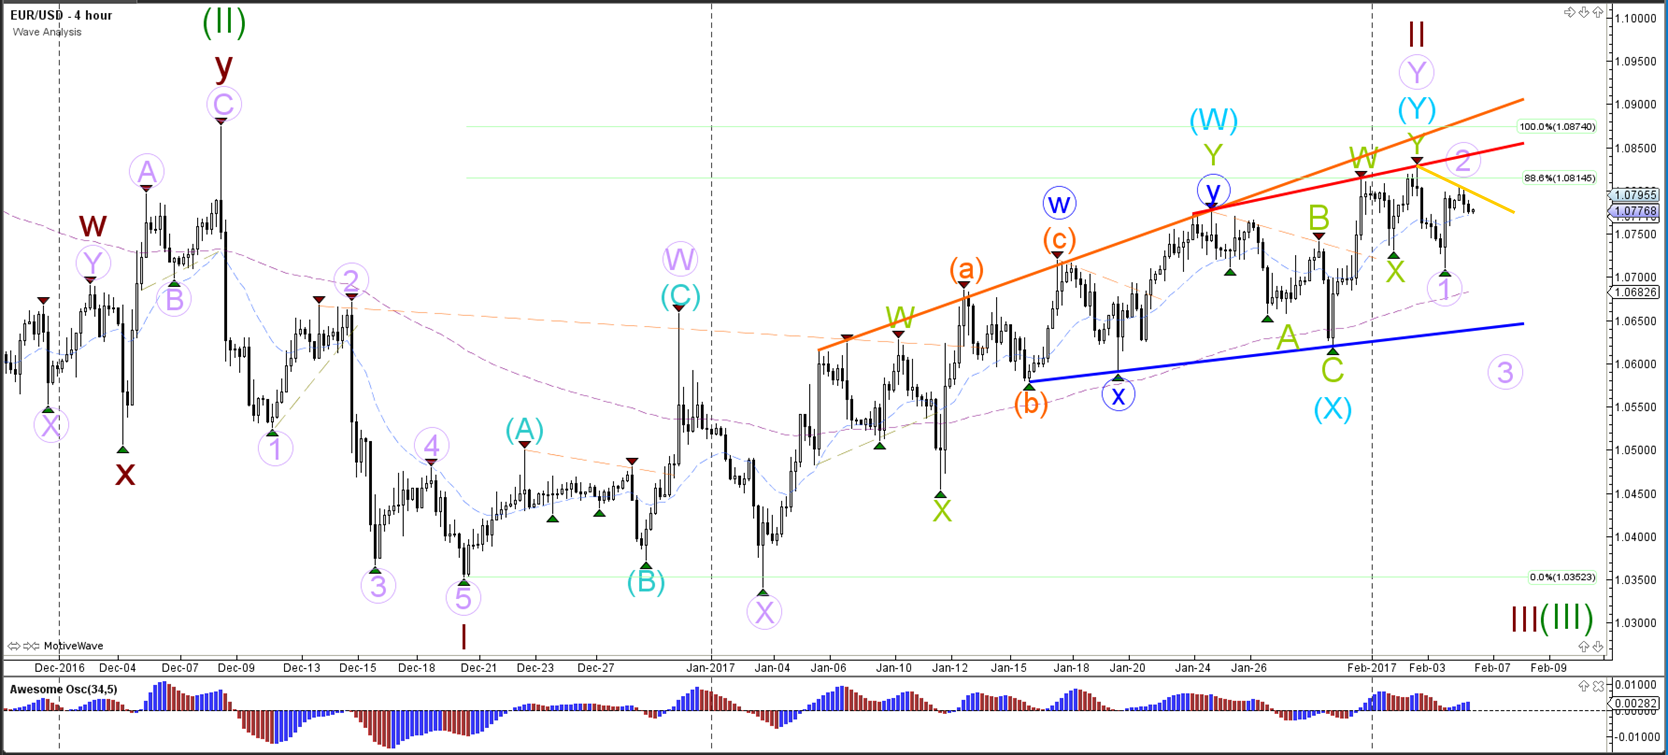
The EUR/USD is retesting the 88.6% level resistance level, which is part of the wave 2 (brown) structure. A break above the 100% Fibonacci level invalidates the wave 2 (brown) whereas a break below the support (blue) trend line is needed before a bearish breakout is possible.
1 hour
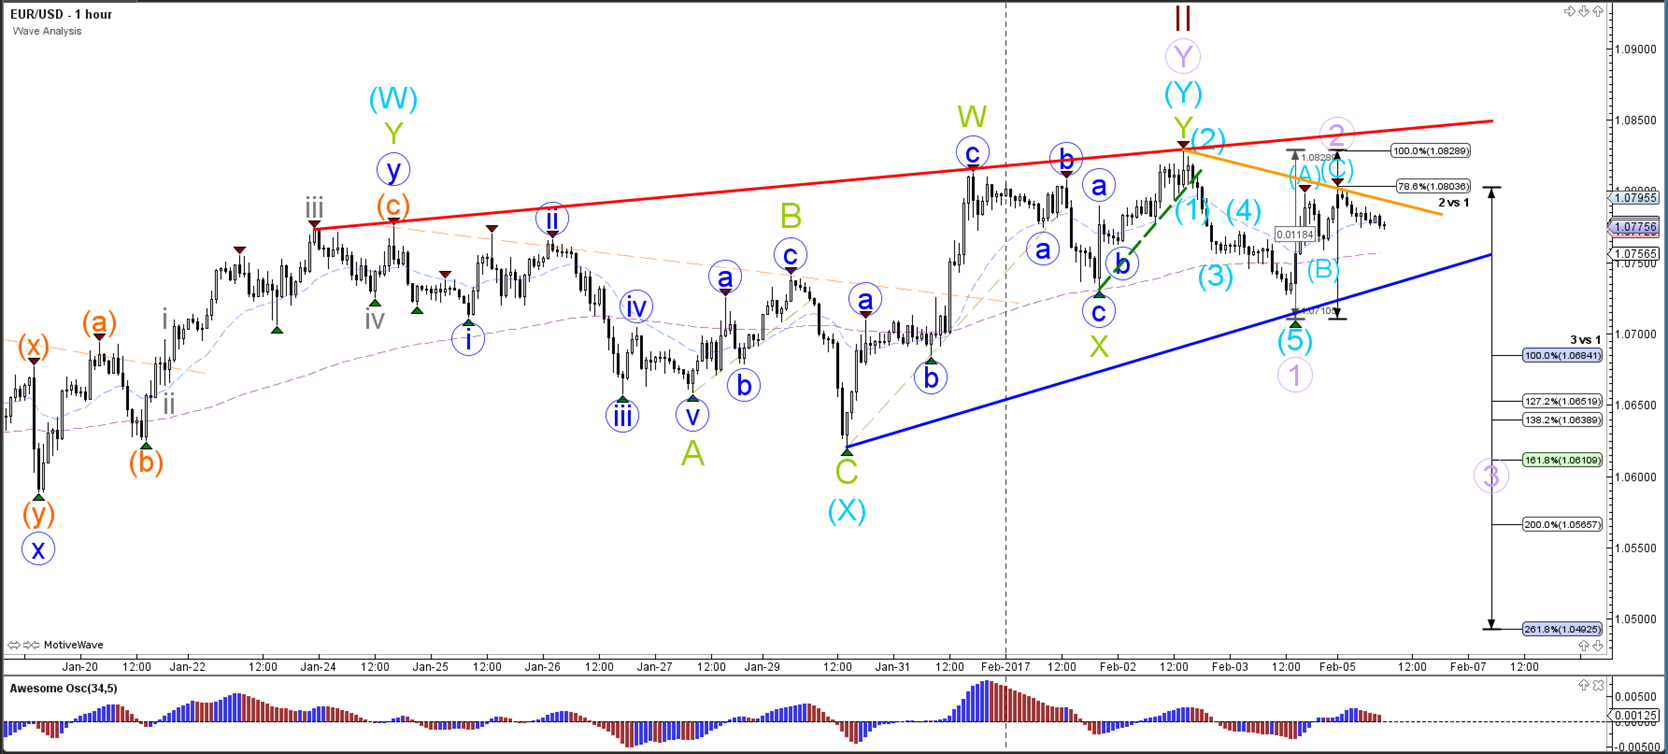
The EUR/USD could be building a pullback via a wave 2 (purple). This wave structure is also invalided if price breaks above the 100% Fibonacci level of wave 2 vs 1 whereas a bearish break below support (blue) could see a wave 3 (purple) develop. The tops could also be building a head and shoulders reversal chart pattern (purple circles). The support (blue) and resistance (red) trend lines also look like rising wedge chart pattern.
GBP/USD
4 hour

The GBP/USD is building a bearish retracement at the resistance trend line (red). A bearish breakout could price test the Fibonacci levels of wave B vs A (blue) whereas a bullish breakout could price develop within wave Y (green).
1 hour
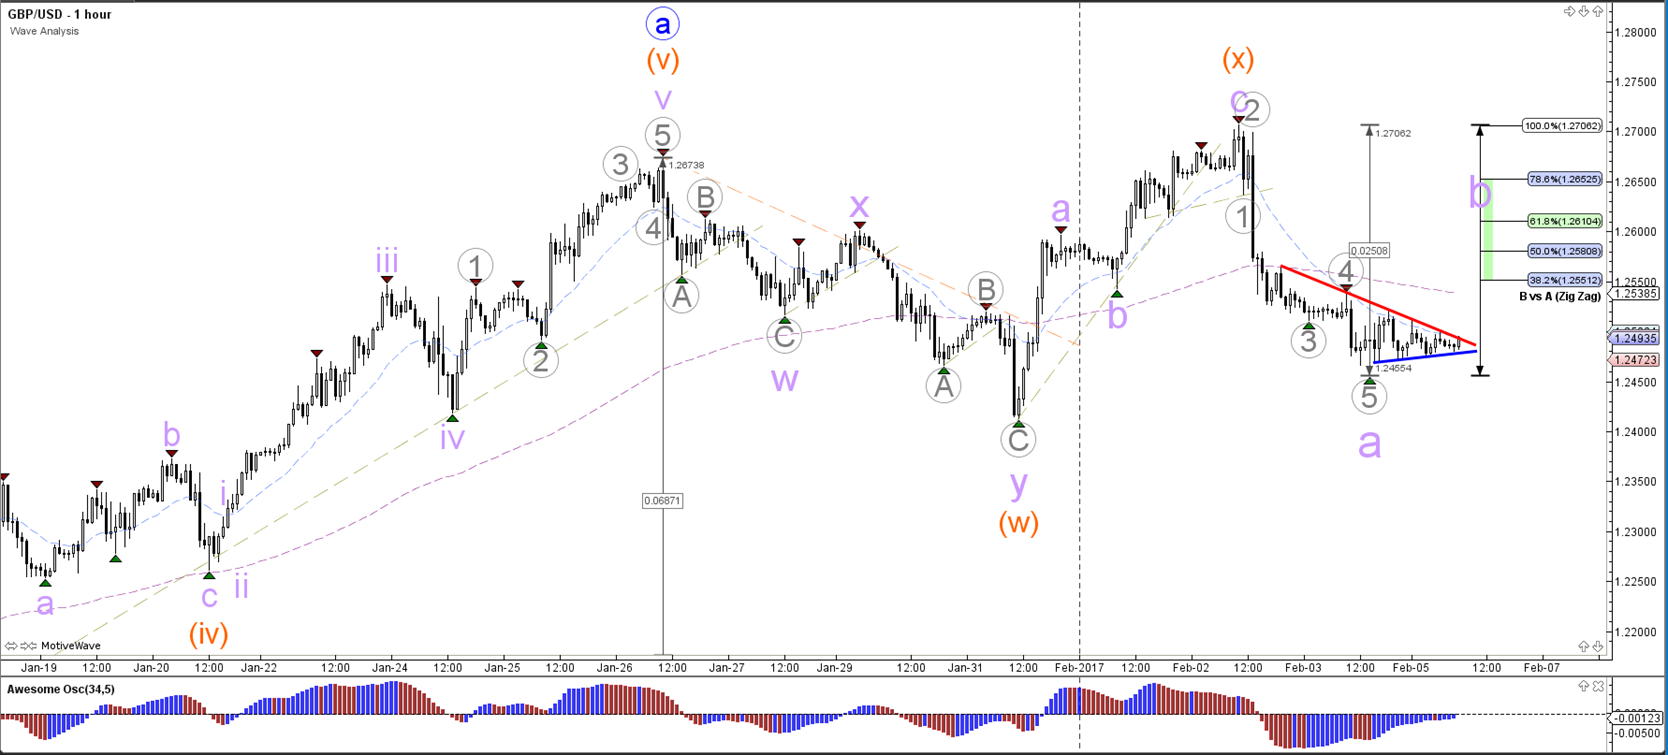
The GBP/USD price action seems to be either a wave 1 or wave A (purple) and a bullish bounce could be part of wave 2 or B (purple). The Fibonacci levels of wave B (purple) could stop price from moving higher but is invalidated if price breaks above the 100% Fibonacci level.
USD/JPY
4 hour

The USD/JPY is building a retracement back to the Fibonacci levels of wave 4 (purple). The 38.2% and 50% are likely support levels to complete a wave 4 (purple).
1 hour
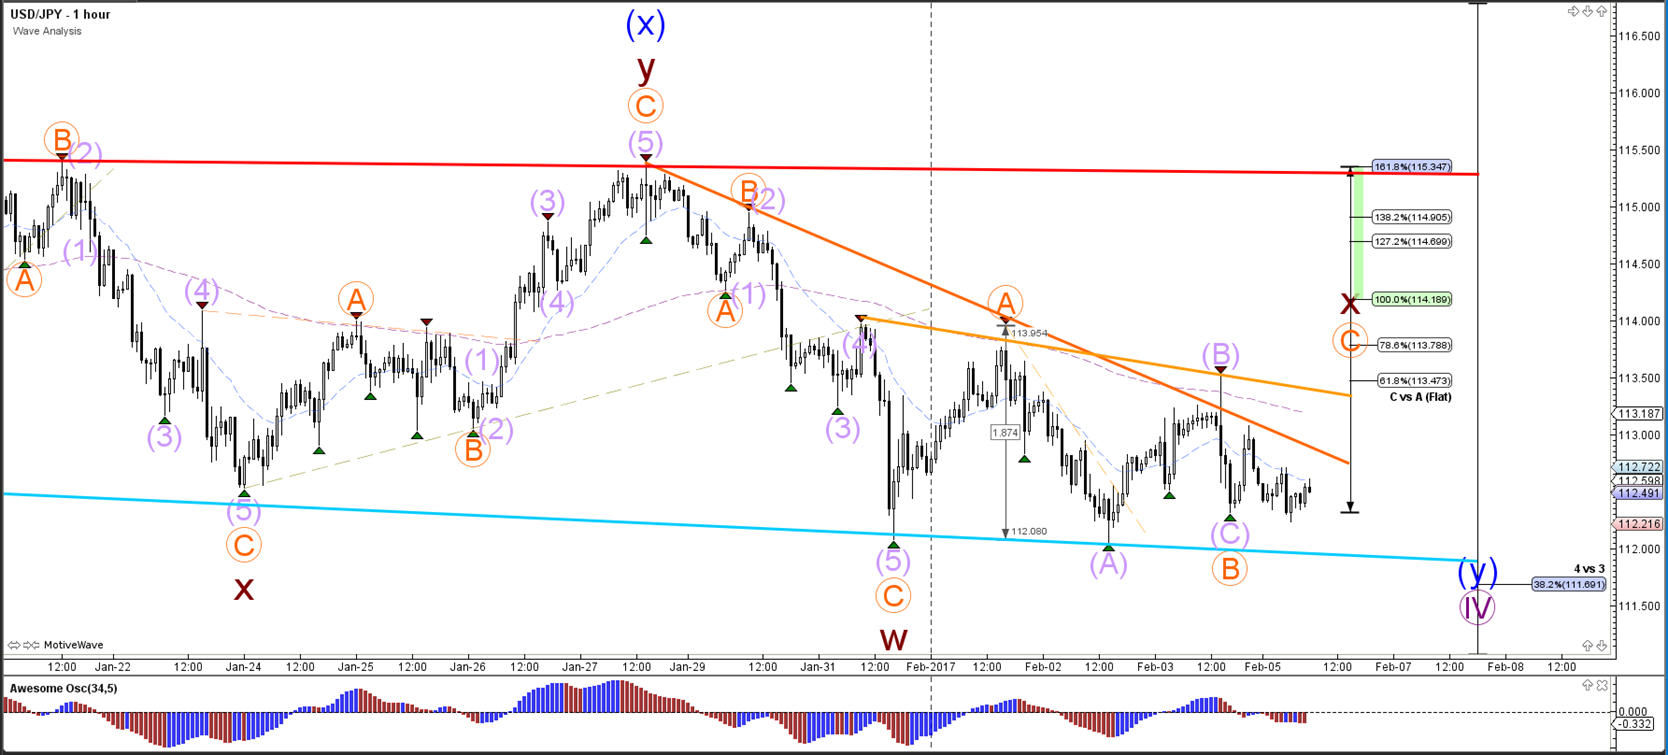
The USD/JPY could be building a bullish ABC (orange) zigzag within wave X (brown).


Leave A Comment