
Last week, we highlighted the bearish head-and-shoulders pattern forming on the US Dollar Index (see “Dollar Index Head-and-Shoulders Pattern in Play After Weak Inflation Data” for more). With the euro making up nearly 60% of the dollar index, it’s not surprising that a similar, inverted head-and-shoulders pattern is forming on EUR/USD, as we’ll see below. That said, the longer-term context of the EUR/USD setup makes it particularly interesting.
Specifically, the current inverted head and shoulders pattern on the EUR/USD daily chart, if confirmed, would mark a failure of the well-defined traditional head-and-shoulders pattern on the pair’s weekly chart. As the chart below shows, the pair broke below the neckline at a key long-term previous-resistance-turned-support zone around 1.1500 last month but quickly recovered back above that key area. With the weekly RSI breaking out to its highest level in months, the risk of a sharp rally after the failed breakout is growing:
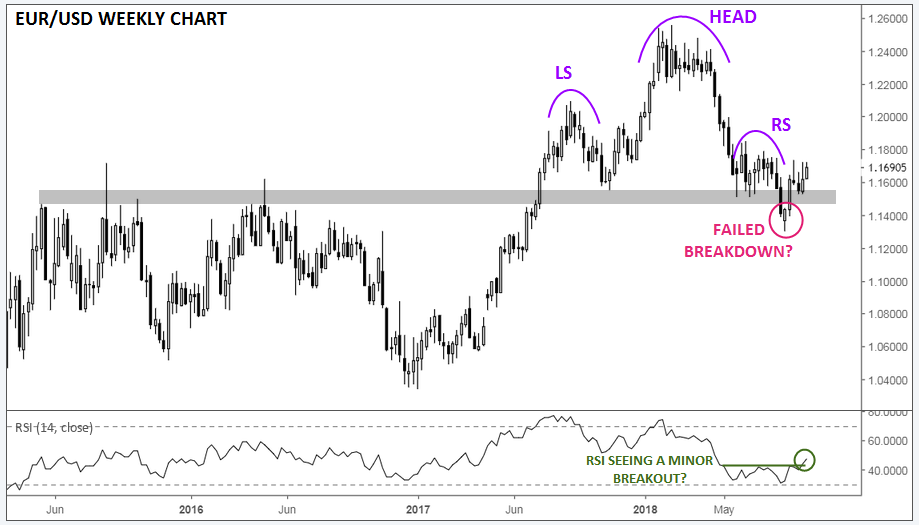
Source: TradingView, FOREX.com
As we hinted above, the false breakdown on the weekly chart corresponds with an inverted head-and-shoulders pattern on the daily chart. This pattern, which is equally well-defined, may mark the end of the near-term bearish trend. If confirmed by a break above the neckline near 1.1700, this pattern would suggest a “measured move” objective of 400 pips, or up around 1.2100.
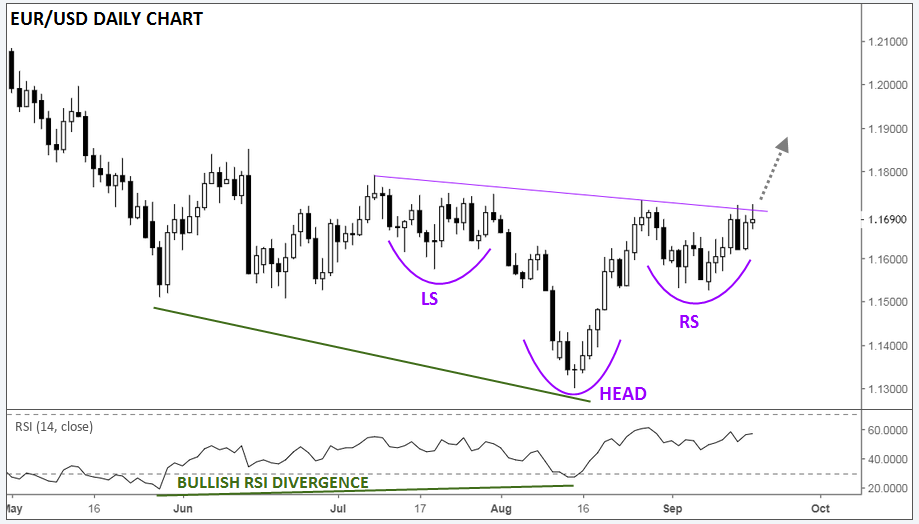
Source: TradingView, FOREX.com
There’s little in the way of traditional economic data on the calendar from either the US or Europe this week, though traders will key in on ECB President Mario Draghi’s speech on the future of economic policy in the euro area tomorrow, as well as the Flash PMI readings from the Eurozone on Friday.


Leave A Comment