The EUR/USD tumbled down below 1.1500 as the US Dollar swept higher alongside rising bond yields, upbeat data, and a hawkish speech by Powell. What’s next?
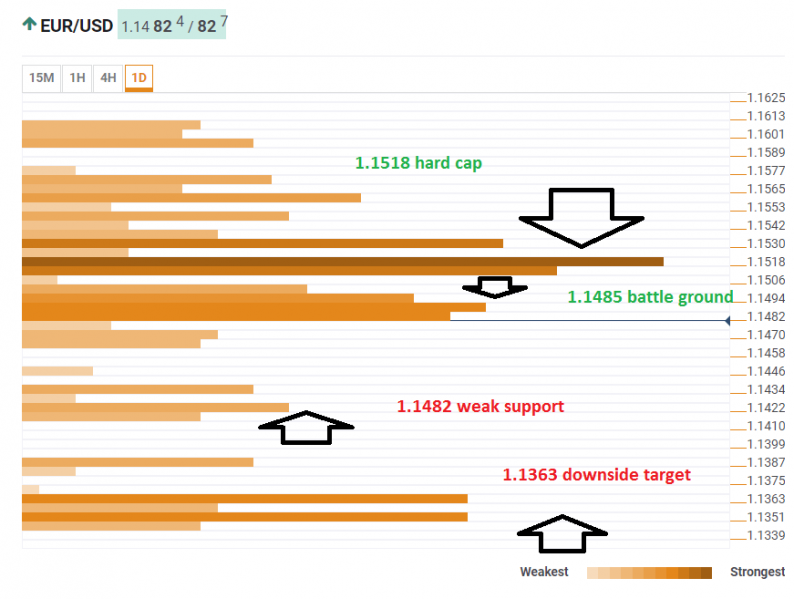
The Technical Confluences Indicator shows that the world’s most popular currency pair is struggling with a cluster of resistance around 1.1485. The congestion consists of the Bollinger Band 15m-Upper, the BB 4h-Lower, the Simple Moving Average 5-15m, the Pivot Point one-month Support 1, and the BB one-day Lower.
If the pair can move higher and recapture 1.1500, the next cap is quite close. 1.1518 is the convergence of the all-important Fibonacci 38.2% one-day, the SMA 100-15m, the SMA 5-4h, and the PP one-week S1.
Looking down, the confluence areas of support are quite feeble. At 1.1422 we see the meeting point of the PP one-week S2 and the PP one-day S1.
More substantial support is only at 1.1363 where we see the PP one-month S2 and the Fibonacci 161.8% one-month converge.
Here is how it looks on the tool:

Confluence Detector
The Confluence Detector finds exciting opportunities using Technical Confluences. The TC is a tool to locate and point out those price levels where there is a congestion of indicators, moving averages, Fibonacci levels, Pivot Points, etc. Knowing where these congestion points are located is very useful for the trader, and can be used as a basis for different strategies.
This tool assigns a certain amount of “weight” to each indicator, and this “weight” can influence adjacents price levels. These weightings mean that one price level without any indicator or moving average but under the influence of two “strongly weighted” levels accumulate more resistance than their neighbors. In these cases, the tool signals resistance in apparently empty areas.


Leave A Comment