
The EUR/USD leaped after President Trump criticized the Federal Reserve and expressed his desire for lower interest rates. What levels should we look out for?
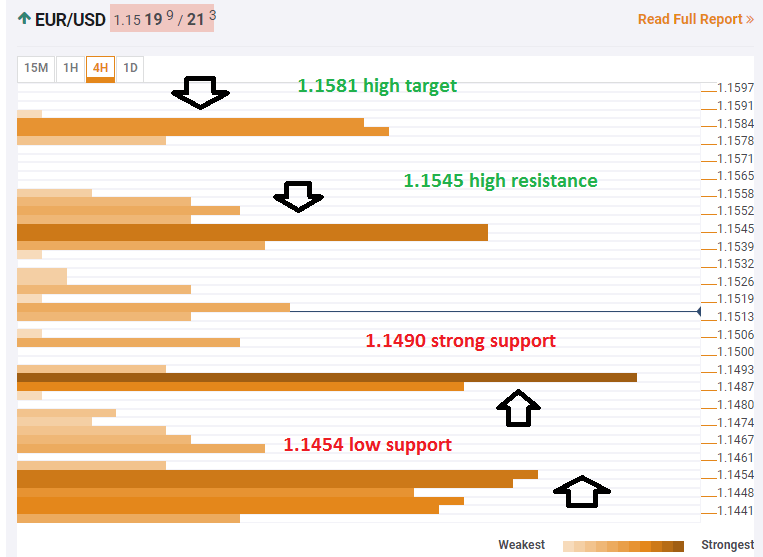
The Technical Confluences Indicator shows that the pair has strong support at 1.1490 where we see the convergence of the Pivot Point one-week Resistance 1, the four-hour low, and the one-day high.
If the pair loses this level, the next cushion is at 1.1454 where we see the confluence of the Simple Moving Average 10-4h, the SMA 10-one-day, and the potent Fibonacci 38.2% one-day.
On the topside, the pair has resistance at around 1.1545 where we see the congestion of the Pivot Point one-week R2, the one-hour high, the four-hour high, the PP one-day R2, and the Bolinger Band 15m-Upper. This could limit any upside.
In case the pair does break higher, 1.1581 is the confluence of the PP one-month Support 1 and the SMA 200-4h.
Here is how it looks on the tool:
Confluence Detector
The Confluence Detector finds exciting opportunities using Technical Confluences. The TC is a tool to locate and point out those price levels where there is a congestion of indicators, moving averages, Fibonacci levels, Pivot Points, etc. Knowing where these congestion points are located is very useful for the trader, and can be used as a basis for different strategies.
This tool assigns a certain amount of “weight” to each indicator, and this “weight” can influence adjacents price levels. These weightings mean that one price level without any indicator or moving average but under the influence of two “strongly weighted” levels accumulate more resistance than their neighbors. In these cases, the tool signals resistance in apparently empty areas.


Leave A Comment