The EUR/USD managed to recover on hopes for a trade settlement between China and the US. Where next?
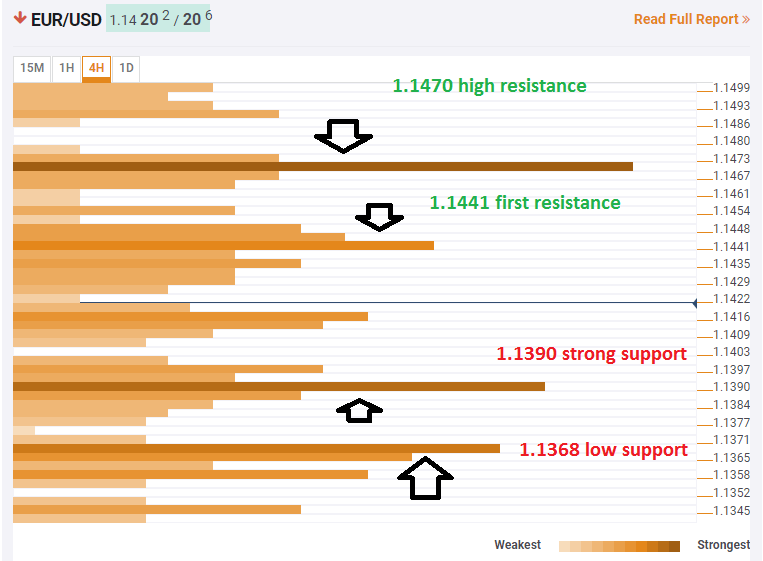
The Technical Confluences Indicator shows that there is a convergence of potent technical levels at 1.1441: the Simple Moving Average 200-one-hour, the Fibonacci 161.8% one-month, and the Bolinger Band 15m-Upper.
Further up, 1.1470 is another important resistance area with the Pivot Point one-day Resistance 1, the PP one-month Support 2, and the SMA 10-one-day.
On the downside, the pair has support 1.1390 is the confluence of the Pivot Point one-day S1 and the Fibonacci 38.2% one-week.
The next support area is close by at 1.1368 which is the meeting point of the Pivot Point one-month Support 3 and the one-day low.
While the pair is looking for a new direction, the trading range is well-defined.
Here is how it looks on the tool:

Confluence Detector
The Confluence Detector finds exciting opportunities using Technical Confluences. The TC is a tool to locate and point out those price levels where there is a congestion of indicators, moving averages, Fibonacci levels, Pivot Points, etc. Knowing where these congestion points are located is very useful for the trader, and can be used as a basis for different strategies.
This tool assigns a certain amount of “weight” to each indicator, and this “weight” can influence adjacents price levels. These weightings mean that one price level without any indicator or moving average but under the influence of two “strongly weighted” levels accumulate more resistance than their neighbors. In these cases, the tool signals resistance in apparently empty areas.


Leave A Comment