Previous:
Yesterday, Tuesday, November 7th, trading on the euro/dollar pair closed slightly down (-19 pips). In Europe, the euro dropped to 1.1554 as the US dollar rose across the board. The head and shoulders model looks to be continuing its formation and a sharp reversal looks on the cards. This kind of behavior can be compared to when, after a run, you try to catch your breath and get punched in the stomach. It messes with your breathing so much that you don’t want to run anymore. Declines along with sharp rebounds are good for intraday traders who are working within a limited range, but annoying for trend followers.
The euro then restored from 1.1554 to 1.1590, and in Asia, rose further to 1.1606. The dollar’s decline has been linked to a report by the Washington Post that Republican senators are considering delaying a major part of the tax reform program by a year.
Day’s news (GMT+3):

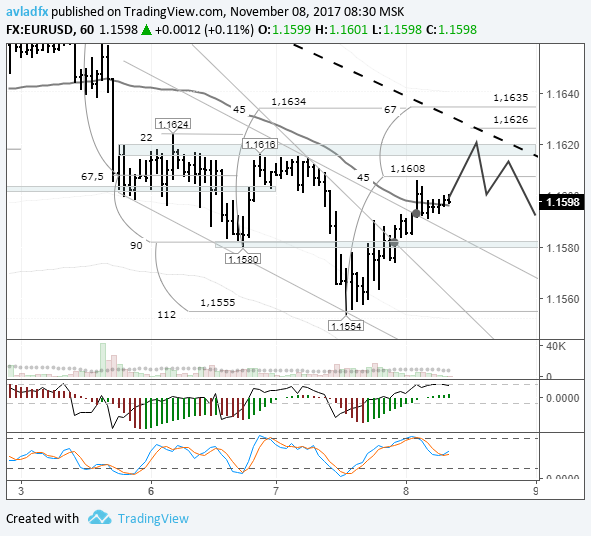
Fig 1. EUR/USD rate on the hourly. Source: TradingView
When I wrote Tuesday’s review, the euro was trading at 1.1605. In Asia, it dropped to 1.1598. The Asian maximum is at 1.1606. The dollar dropped against the yen and other currencies after some harsh comments from President Trump directed at North Korea, warning them to stop threatening the USA.
The price still met with the LB balance line, but I don’t really like the current situation in terms of selling. Although the price rebounded from this and dropped to 1.1588, I have no desire to sell euros. First of all, the trend line from the 1.1693 high has been broken through. Secondly, the upper boundary of the channel has also been broken through, which is formed from subsequent lows. I’ve marked the breakouts with dots on the chart.


Leave A Comment