This morning’s release of the June Existing-Home Sales decreased from the previous month to a seasonally adjusted annual rate of 5.52 million units. The Investing.com consensus was for 5.58 million. The latest number represents a 1.8% decrease from the previous month and a 0.7% increase year-over-year.
Here is an excerpt from today’s report from the National Association of Realtors.
Lawrence Yun, NAR chief economist, says the previous three-month lull in contract activity translated to a pullback in existing sales in June. “Closings were down in most of the country last month because interested buyers are being tripped up by supply that remains stuck at a meager level and price growth that’s straining their budget,” he said. “The demand for buying a home is as strong as it has been since before the Great Recession. Listings in the affordable price range continue to be scooped up rapidly, but the severe housing shortages inflicting many markets are keeping a large segment of would-be buyers on the sidelines.” [Full Report]
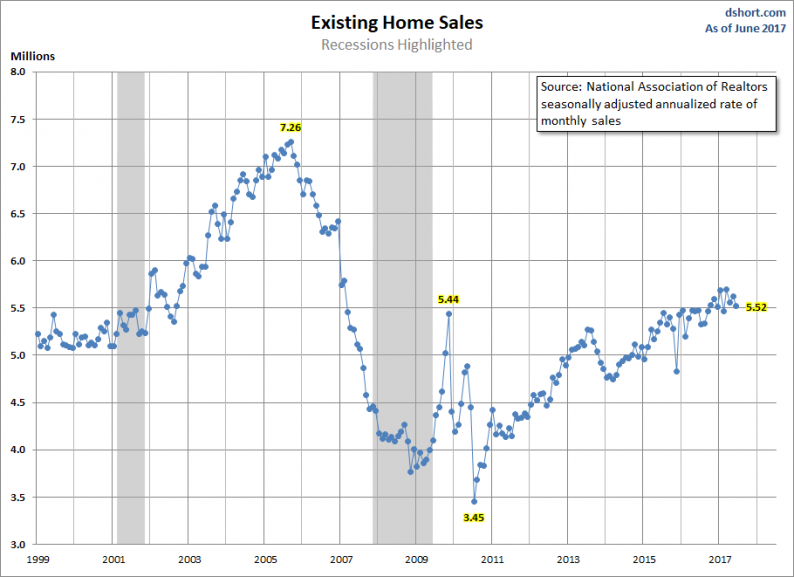
For a longer-term perspective, here is a snapshot of the data series, which comes from the National Association of Realtors. The data since January 1999 was previously available in the St. Louis Fed’s FRED repository and is now only available from January 2014. It can be found here.
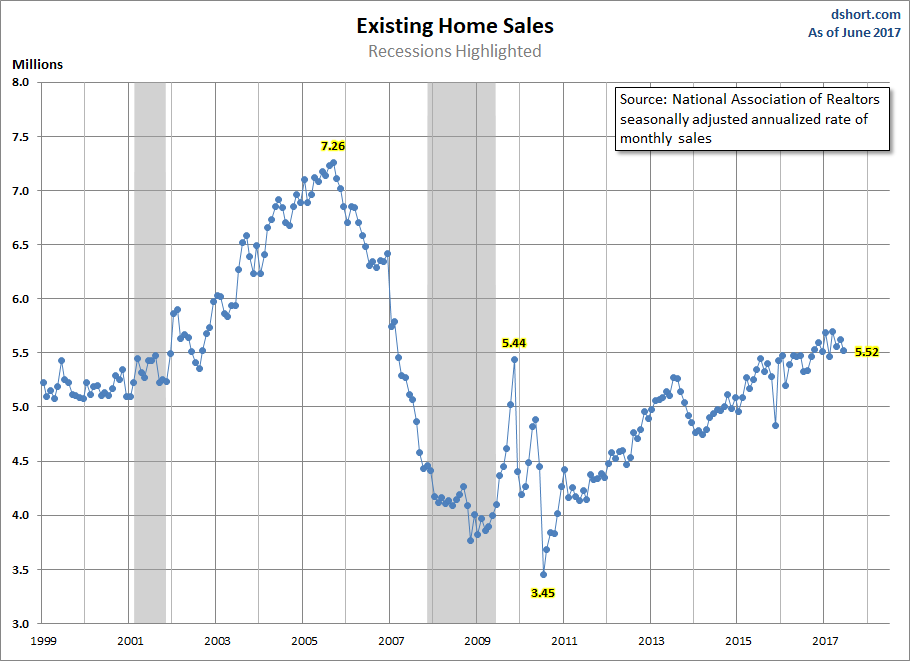
Over this time frame, we clearly see the Real Estate Bubble, which peaked in 2005 and then fell dramatically. Sales were volatile for the first year or so following the Great Recession. The latest estimate puts us back to levels reached before the recession.
The Population-Adjusted Reality
Now let’s examine the data with a simple population adjustment. The Census Bureau’s mid-month population estimates show a 17.1% increase in the US population since the turn of the century. The snapshot below is an overlay of the NAR’s annualized estimates with a population-adjusted version.


Leave A Comment