
The Producer Price Index year-over-year inflation marginally grew from 2.7 % to 2.8 %.

Analyst Opinion of Producer Prices
The Producer Price Index marginally grew year-over-year. Here is what the BLS said in part:
For the 12 months ended in February, prices for final demand less foods, energy, and trade services increased 2.7 percent, the largest rise since 12-month percent change data were available in August 2014.
Although the monthly growth numbers appear high, the year-over-year numbers changed little from last month – except for unprocessed goods for intermediate demand which doubled.
The PPI represents inflation pressure (or lack thereof) that migrates into consumer price.
The market had been expecting (from Bloomberg):
The producer price inflation breakdown:

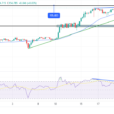
In the following graph, one can see the relationship between the year-over-year change in intermediate goods index and finished goods index. When the crude goods growth falls under finish goods – it usually drags finished goods lower.
Percent Change Year-over-Year – Comparing PPI Finished Goods (blue line) to PPI Intermediate Goods (red line)

Econintersect has shown how pricing change moves from the PPI to the Consumer Price Index (CPI).


Leave A Comment