
The Federal Housing Finance Agency (FHFA) has released its U.S. House Price Index (HPI) for June. Here is the opening of the report:
Washington, D.C. – U.S. house prices rose 1.6 percent in the second quarter of 2017 according to the Federal Housing Finance Agency (FHFA) House Price Index (HPI). House prices rose 6.6 percent from the second quarter of 2016 to the second quarter of 2017. FHFA’s seasonally adjusted monthly index for June was up 0.1 percent from May.
The HPI is calculated using home sales price information from mortgages sold to, or guaranteed by, Fannie Mae and Freddie Mac. FHFA has produced a video of highlights for this quarter.
“U.S. house prices rose in nearly every state during the second quarter,” said FHFA Senior Economist William Doerner. “New home sales are climbing but, relative to the overall population, they still remain low from a historical perspective. The tight inventory is a major explanation for why house prices have been increasing every quarter over the last six years.” [Link to report]
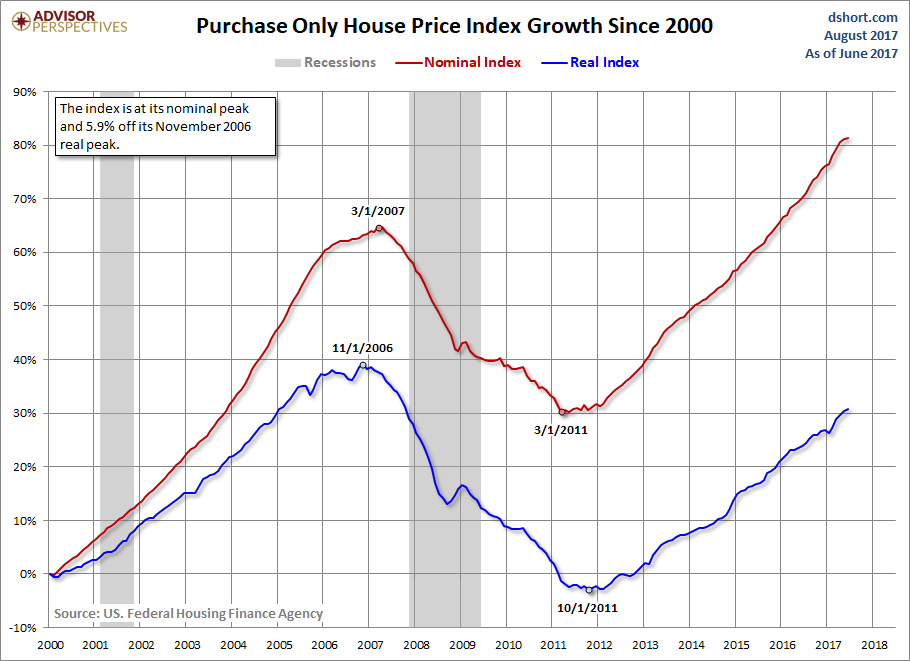
The chart below illustrates the monthly HPI series, which is not adjusted for inflation, along with a real (inflation-adjusted) series using the Consumer Price Index: All Items Less Shelter.

In the chart above we see that the nominal HPI index has exceeded its pre-recession peak of what’s generally regarded to have been a housing bubble. Adjusted for inflation, the index remains off its historic high.
The next chart shows the growth of the nominal and real index since the turn of the century.
For an interesting comparison, let’s overlay the HPI and the most closely matching subcomponent of the Consumer Price Index, Owners’ Equivalent Rent of Residences (OER). Note: For an explanation of OER, see this PDF commentary from the Bureau of Labor Statistics.

HPI and OER moved in close parallel from the 1991 inception date of the former until early 1999, when the two parted company and HPI began accelerating into the housing bubble. HPI then fell 20.7% over the next 48 months to its March 2007 trough. Confirmation of the “bubble” designation for house prices is the 40.1% spread between HPI and OER in January 2006.


Leave A Comment