
As we turn the page into the second quarter of 2018, a number of interesting themes remain across global financial markets. The first quarter of this year turned out to be quite eventful. We got the rate hike out of the Federal Reserve in March and the Fed is now forecasting an additional two moves in the year. We saw the Bank of England prep markets for a possible rate hike in May, and even the European Central Bank started to shift their language for what could lead to an eventual tightening of policy. This is the move that many have been waiting for (or fearing?) since the QE-heavy environment took over after the Financial Collapse, and this is when we see global Central Banks shift away from Quantitative Easing and uber-dovish monetary policy towards a more balanced stance and, in some cases, even Quantitative Tightening.
Below, we’re looking at three of the more interesting FX-related themes as we walk into Q2 of 2018, focusing-in on three of the world’s largest open economies and what may come about as we move deeper into the year. We discussed this topic in yesterday’s webinar, and if you’d prefer video or would just like a video accompaniment, that archive is available from the following link: Q2 Preview: USD Weakness, Yen Strength, Equity Vol in the Spotlight.
THE US DOLLAR’S PERSISTENT WEAKNESS CONTINUES
All in all, it wasn’t that bad of a quarter for the US Dollar. As we opened into the New Year this certainly didn’t seem as though it would be the case, as sellers continued to push the Greenback lower for the first few weeks of the year. But – a longer-term level of support came into play in January, and after another test in February prices continued to meander back-and-forth, building into the range that we were looking for in our Q1 technical forecast on the US Dollar.
US DOLLAR VIA ‘DXY’ WEEKLY CHART: FIBONACCI SUPPORT IN JANUARY, FEBRUARY HOLDS THE LOWS
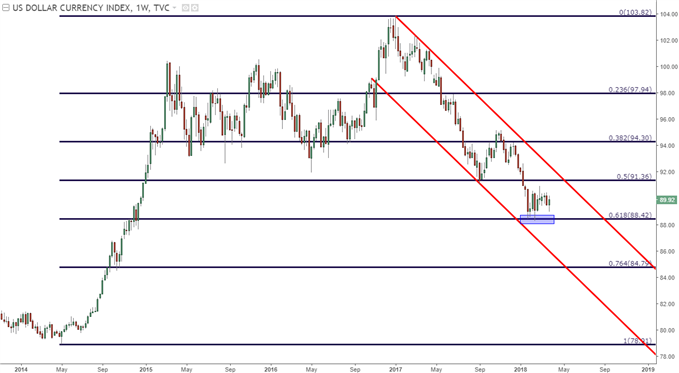
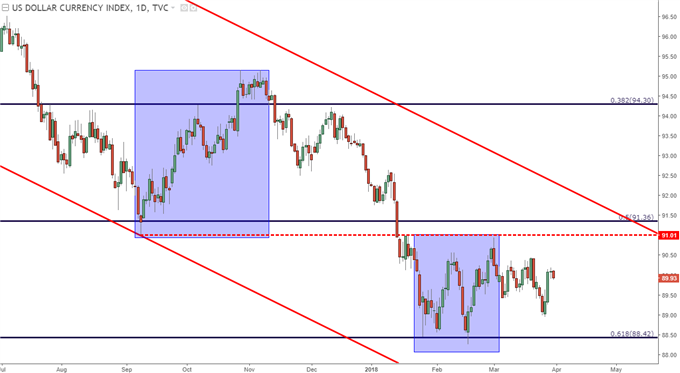
That longer-term area of support remains underneath price action, and this is taken from the 61.8% Fibonacci retracement of the 2014-2017 major move. The 50% retracement from that same study had helped us to carve out last year’s low in September, and that support inflection led to two months of strength. The support test at the 61.8 hasn’t led to as bullish of a response, and bears have remained fairly active here, continuing to come in to offer resistance below the 2017 low of 91.01 on DXY.
US DOLLAR VIA ‘DXY’ DAILY CHART: A LESS ENTHUSIASTIC RESPONSE TO FIBONACCI SUPPORT
Making this price action a bit more interesting is the backdrop. The Federal Reserve is one of the few large Central Banks actually looking at higher rates and tighter policy. This runs in stark contrast to many economies that are still at ‘pedal to the floor’ levels of accommodation, like Europe or Japan. And generally speaking, higher rates and tighter policy will bring strength into a currency as investors look to capture the new, higher rate of return.
Not only has that not been happening in the US Dollar, but we’ve basically been witnessing the opposite of that; begging the question of ‘why’?


Leave A Comment