The official trade reports take a few months to come out which is why I can only can say growth slowed from the beginning of the year to May. The official numbers are very important, but if you want up to the minute results, you can review the indicators below.
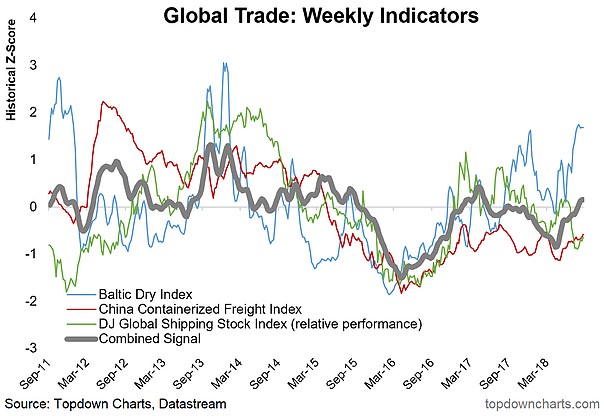
As you can see, it shows the Baltic Dry index, the China Containerized Freight index and the DJ Global Shipping Stock index. To be clear, this is a z-score, not year over year growth. The overall index now has a positive z-score because the Baltic Dry index has recently spiked. Interestingly, the Shanghai Composite has been rising recently. Since August 17, the index is up 4.2%.
This could be a temporary blip, or a sign of some improvement in China. China drives global trade growth.

Peak Manufacturers’ New Orders?
The manufacturing sector was very strong in the first half. Manufacturing is the most cyclical part of the economy which is why I have been skeptical of a permanently high plateau.
The chart below is a great depiction of why I think manufacturing can’t grow much from here and has a lot of room to fall. As you can see, manufactures’ new orders for non-defense capital goods excluding aircrafts peaked at $70 billion last cycle and peaked at that rate earlier in this cycle. It peaked at a slightly lower level in the previous cycle.
We’re back at the ceiling with global growth slowing and trade growth slowing. Manufacturing is more global than services which is why I expect it to slow soon.

End Of Synchronized Growth
I have documented throughout this year that the global synchronized growth story has ended. The chart below shows the synchronization of developed economies to the global average.
Not only are emerging markets falling out of sync with American growth, but also some developed markets are out of sync with the global average.
The chart below shows the developed economies have about a 0.45 correlation which is down from about 0.65 earlier in the year. This is probably caused by weakness in Europe.


Leave A Comment