
The Gold Direction Indicator has just turned positive again, at 71%.
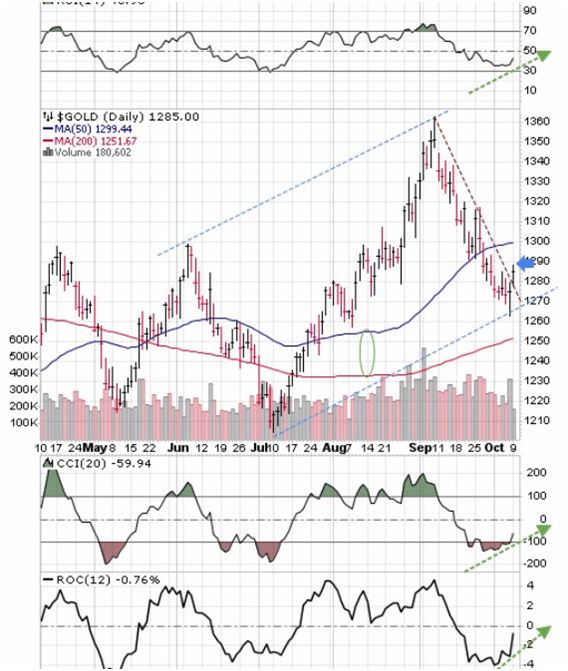
Featured is the daily gold chart. Price found support on Friday and produced an upside reversal. Then on Monday gold began to break out at the downtrendline. A close above the blue arrow will confirm the breakout with a target at $1360. The supporting indicators are positive, as well as the moving averages which are in positive alignment and rising. The Gold Direction Indicator closed at 71%.
Gold usually rallies after the Chinese ‘Golden Week’ holiday, (see charts courtesy Zerohedge.com). .
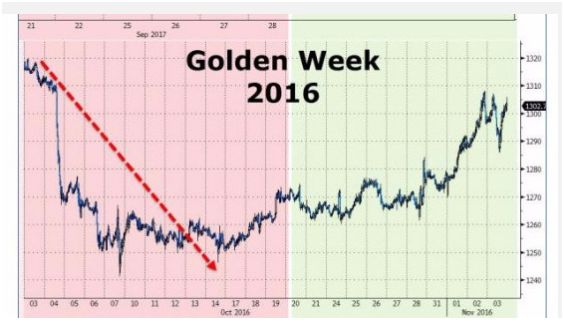
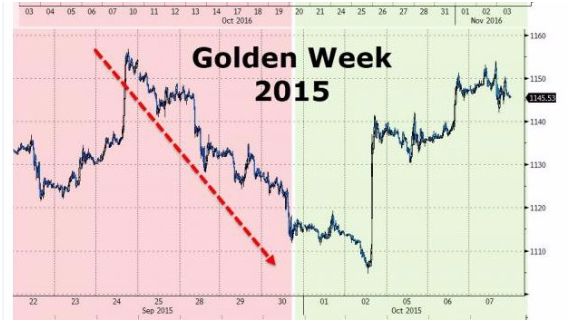


These five charts are courtesy Zerohedge.com.The first four show what happened to gold at the end of the Golden Week holiday in China (usually at the end of September, or beginning of October).Chart #5 appears ready to follow in the footsteps of the prior 4 charts.
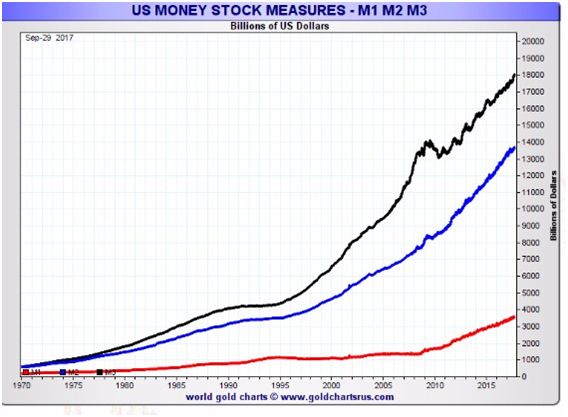
This chart courtesy Goldchartsrus.com shows US money supply continues to rise. This sets the stage for a similar rise in the price of precious metals.

Featured is a chart that compares the gold mining index to the gold price. The trend favors mining stocks, and that is bullish for both stocks and bullion, but most of all for mining stocks. A new rally appears to be getting underway, as price is breaking out at the blue arrow.
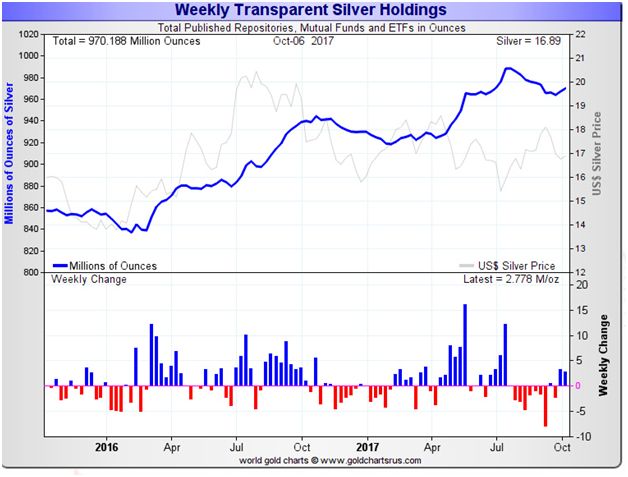
This chart courtesy Goldchartsrus.com shows the amount of silver in ETFs and Trusts is increasing, after 2 months of declines.

Featured is the weekly SLV silver ETF chart. Price is breaking out at the downtrend line and the supporting indicators are positive. The target is 17.00. This target lines up with silver bullion at 18.50.


Leave A Comment