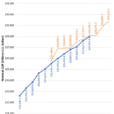
This chart looks at the US Dollar/Gold ratio on a monthly basis over the past 25-years. When the ratio peaked back in 2000/2001 the great bull run for Gold and Silver got started. The bull run for metals continued until the ratio bottomed back in 2011, at the bottom of falling channel (A).
After hitting support in 2011, the ratio started heading higher, creating the rising channel (1). The 7-year rally in this ratio and 7-year bear market in metals is experiencing a monster important price point this month at (2).
The ratio is testing the top of 17-year falling channel (A), which comes into play as resistance at this time. As the month is coming to a close, the ratio could be creating a bearish reversal pattern (bearish wick) at (2).
Metals bulls need and would LOVE to see the ratio peaking at (2). If it does peak and heads lower, it could reflect that the end of the 7-year bear market for metals could be forming.
Should the ratio breakout of its 17-year falling channel at (2), it would send a strong message that the 7-year bear market in metals is not only not over, the ratio could get stronger to the upside!
From a Power of the Pattern perspective, what the ratio does at (2), looks to be one of the most important prices points for Gold in the past 17-years!!!


Leave A Comment