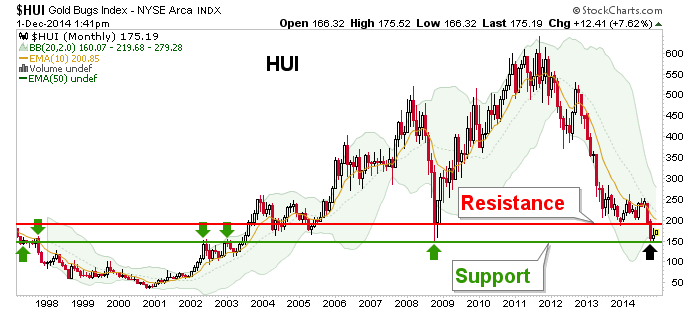
Errr, this chart is starting to get hard to ignore isn’t it? It is a gold mining sector fundamental indicator.

I have no clue how the jockeys using only nominal charts (i.e. the HUI is in breakdown/crash mode, hold the bearish line) and resolutely short the miners, do it.
You can’t use charts in a vacuum. There are these things out there called sector fundamentals, macro fundamentals and indicators that have got to be used jointly in the precious metals. For instance, this chart of HUI is both in breakdown/crash mode and above very important long-term support.
For another example HUI vs. SPX is in a wonderful risk vs. reward stance. Of course, that is pending improvement in the fundamentals, otherwise it’s just a crashed sector against a hugely bullish stock market. You see?

While remaining critical of the gold sector Pom Pom brigade all the way down, I would also caution against perma bears who are preaching crash crash CRASH!. Especially Crashologists who once had higher targets on HUI than my silly 888 and spoke with surety about it as recently as January of 2012. Here is an exact quote…
“All the pain and suffering over the last two years will be totally forgotten when this move tops out north of 1500 over the next year. Thats right, 1500 over the next year.”
As I wrote about the bullish promoters last week over at Biiwii, you can’t make this stuff up. Due to the desire for decorum toward my analytic competitors in this stupid sector, I’ll not link the above noted article. Anyone who cares can go find it themselves.


Leave A Comment