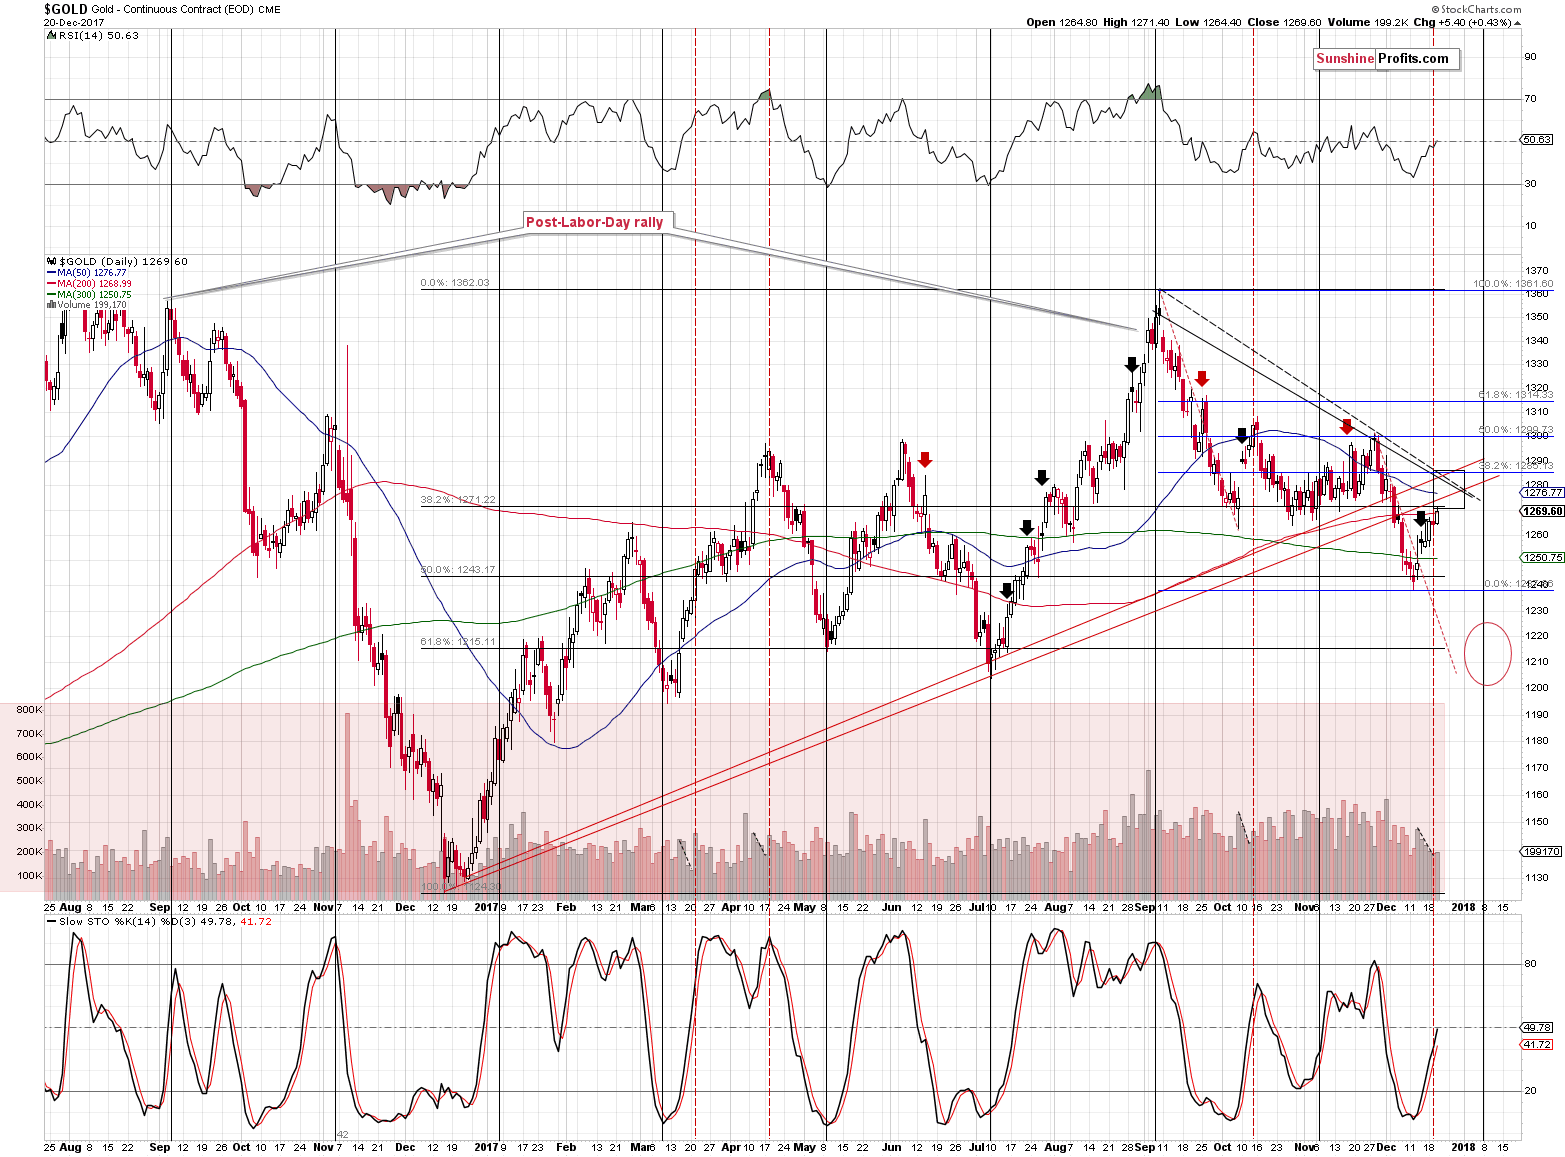
How high can gold rally? To $1,270 – $1,290. That’s what we wrote on December 14. Stockcharts’ intraday high for yesterday’s session is $1,271.40, which means that our target area has already been reached. However, gold will remain in the target area even if the rally continues for another $20 or so. Which scenario is likely to play out and when is it likely to play out? Gold’s chart provides answers, so let’s start today’s analysis by taking a closer look at it (charts courtesy of http://stockcharts.com).

The price of gold has been moving steadily higher in the past several days and it moved to the lower border of our target area.
So, is the rally ending?
Ending – perhaps. Ended – most likely no.
The upper part of the target area is where most resistance levels coincide and since we haven’t seen any meaningful bearish confirmations, gold is likely to move higher in the short term. These resistance levels are:
Moreover, the upper part of the target area (above $1,280) is slightly above the 50-day moving average and in the previous two months gold reversed and started to decline only after it moved a bit above this MA.
There is an additional thing that the above chart tells us.
It answers the “when” question.
There are two turning points that are about to be in play. The first one is today or tomorrow and it’s based on the apex of the triangle created by the two lines that we discussed in the bullet points. OK, what was the apex technique again? We first described the apex technique on October 17 when we discussed the following HUI Index chart:


Leave A Comment