The fact that initial unemployment claims keep making record lows does not mean what Wall Street and its Big Media PR flacks want you to think it means.
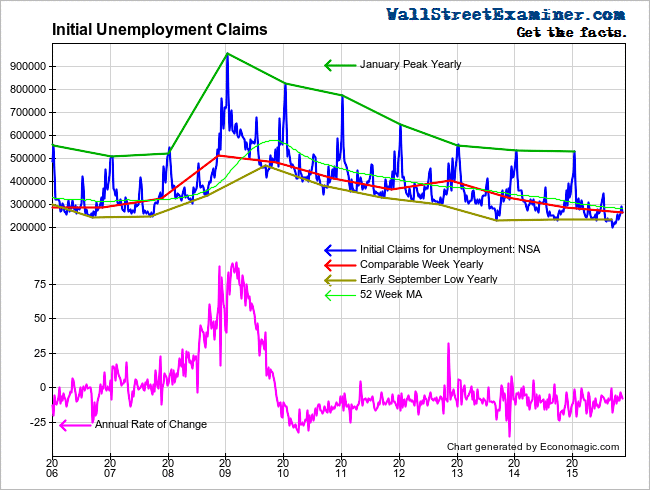
First time claims for unemployment compensation continued their string of record lows for the same week of the year. The actual number, not subject to any seasonal hocus pocus was 263,427. That was just 1,858 claims per million employed workers last week. That compares with 2,270 per million in the same week of 2006 just as the housing bubble was on the brink of deflating, and 2,294 in that week of 1999 as the internet/tech bubble was peaking.
The Department of Labor (DoL) reports the unmanipulated numbers that state unemployment offices actually count and report each week. This week it said, “The advance number of actual initial claims under state programs, unadjusted, totaled 263,427 in the week ending November 14, a decrease of 27,633 (or -9.5 percent) from the previous week. The seasonal factors had expected a decrease of 22,113 (or -7.6 percent) from the previous week. There were 286,115 initial claims in the comparable week in 2014. ”

We use actual data, as opposed to the seasonally manipulated headline numbers which Big Media shovels out for mass consumption. To see from the actual numbers if there’s any evidence of trend change we must look at how the current week compares with the comparable week in prior years.
The actual change for the current week versus the prior week was a decline in claims of -27,633. The 10 year average for actual data for that week was a decrease of -22,688. The same week last year saw a decrease of -23,233.
Week to week changes are noisy. The trend is what matters. Since 2010 the annual change rate each week has mostly fluctuated between -5% and -15%. Last week was within that range with a year to year drop of -7.9%.
A persistent shift to a year to year increase in claims would be a sign that the US economy is headed for recession. That has yet to happen.


Leave A Comment