
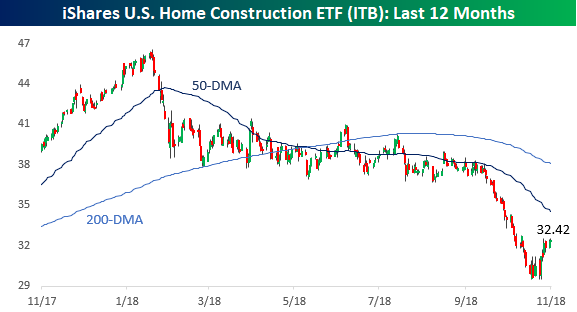
After performing miserably all year, homebuilders stopped going down in mid-September and have rallied close to 10% since. While the iShares Home Construction ETF (ITB) is still down sharply YTD and well below both its 50 and 200-day moving average (DMA), the fact that it finally caught a bid and made a low before the S&P 500 has bulls on the sector optimistic that this could be the beginning of a more substantial rally. Only time will tell if this sentiment is accurate or just wishful thinking.
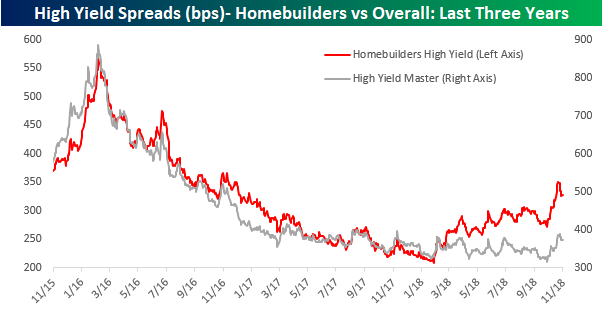
Whenever we see situations like this, one area of the market we like to look at is the fixed income high yield market. The first chart below compares spreads for the overall high yield market to spreads on high yield credit for homebuilders over the last three years. From November 2015 right up through February of this year, spreads in the homebuilder group tracked spreads for the overall high yield market pretty closely. Beginning in late February, though, spreads for the homebuilder group widened out considerably, while spreads in the overall high yield market were much more contained. In fact, in the homebuilder group spreads widened out by over 100 basis points (bps) or 49%, rising from 234 bps in late February to 350 bps as of 10/26.
Looking at this another way, the chart below compares high yield spreads in the homebuilder group (plotted below on an inverted basis) to the price of the iShares Home Construction ETF (ITB) over the last 12 months. During this span, the two series have tracked each other very closely, where big declines in ITB were generally accompanied by much wider spreads in the high yield debt of homebuilders. More recently, as the homebuilder stocks have rallied, spreads for the group have narrowed right along with them.
Looking more closely at this chart, we would note that if you are looking for early signs of a big move in the homebuilder stocks, moves in high yield debt for the group probably won’t be the tipoff. Take a look at the two shaded regions in the chart. Each one of them shows the two big legs lower than the homebuilder stocks (blue line) have seen during the course of the year, but in each case, it was the stocks that led the move in high yield spreads (red line) rather than the other way around. In the case of homebuilders, high yield spreads haven’t been much of a leading indicator this year.


Leave A Comment