
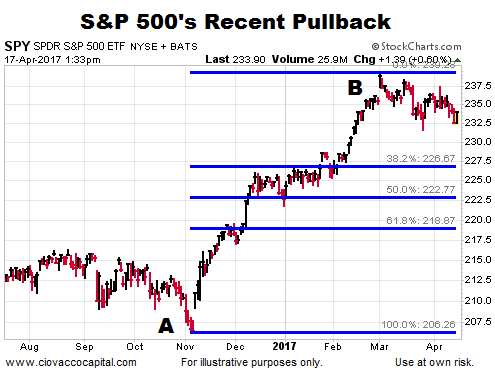
It is normal and to be expected for bullish trends to experience pullbacks or retracements. Typically, a healthy trend will see countertrend moves that remain above the three major Fibonacci retracement levels shown below. As of April 17, the S&P 500 ETF’s (SPY) post-election rally remains in the “normal pullback” zone.
Is The Bigger Picture Showing Some Bearish Cracks?
This week’s stock market video reviews the impact of the recent pullback on the longer-term outlook. The video also covers the emotional impact of portfolio drawdowns.
A Bearish Reference Point
The chart below shows the S&P 500’s 100, 200, and 300-day moving averages during the stock market’s topping process in late 2007/early 2008.

The same moving averages as of April 17 are shown below. Our concerns would increase if the chart below started to morph into a look similar to the chart above.


Leave A Comment