
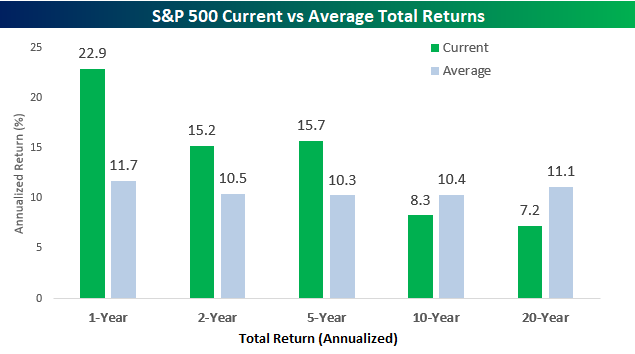
With the S&P 500 finishing November with a gain of 3.1% on a total return basis, the index saw its 13th straight month of gains. That’s right. Since last November’s election, US equities haven’t seen a down month, which is pretty remarkable when you think about it. With such continuous strength, the S&P 500’s total return over the last 12 months has been a gain of 22.9%, which is nearly double the historical average of 11.7%!
In the chart below, we have compared the S&P 500’s current one, two, five, ten, and twenty-year annualized total returns to their historical averages going back to the late 1920s. In the short to intermediate term, returns have been consistently above average with both the two and five-year annualized returns of over 15% exceeding the historical average by around five percentage points per year. Longer term, though, the impacts of the financial crisis and dot-com bust are still making their presence felt. Over the last ten years, the S&P 500’s 8.3% annualized return trails the historical average by about two percentage points, while the twenty-year annualized return of 7.2% trails the historical average of 11.1% by a pretty wide margin. The US equity market has obviously exited the dark ages of the early 2000s, but the scars, however, faded they have become, are still there. Only time can heal.


Leave A Comment