
In December 2016, the Federal Reserve raised its Fed funds target interest rate for only the second time in over 10 years, the first time being in December 2015.
Now a possible Fed rate hike this week (March 14/15) is currently priced in by traders as a virtual certainty, via the CME Group FedWatch tool. This is a big perception change from just three weeks ago when it was less than 25% on an increase.
And the Fed plans more rate hikes later in 2017, 2018 and likely into 2019, two to four total increases each year.
Should you be concerned that interest rates (TLT) look to have bottomed after a long stagnant period at historically low levels?
Not necessarily.
First, let’s put into perspective just how low rates have been and how long they have stayed low.
Take a look at the chart below, which is from the St. Louis Fed:
Effective Federal Funds Rate Chart
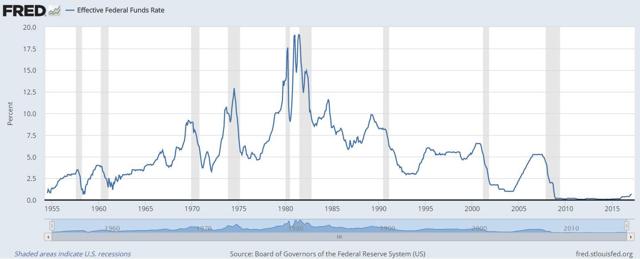
You can see that rates haven’t maintained such a low level, for such a long period, at any time in the past 60 years. So, the bottom line on an absolute basis is that the Fed Funds rate is extremely low compared to normal levels, and small bumps higher in it are somewhat insignificant on an absolute basis.
What are some historical parallels for the current anticipated rate hike cycle, and how did they affect the stock market?
Well, over the past 20 years, there have only been three generally recognized Fed rate hike cycles – in 1997, 1999 to 2000 and 2004 to 2006.
The 2004 to 2006 cycle is the most similar to the current anticipated setup, as it lasted two years. It went from a beginning Fed funds rate of 1% to a peak rate of 5.25%.
The current cycle that began in December 2015 may be different than that, as it will likely last longer than two years, and it is not projected to take rates nearly as high. Expectations are that the Fed will look to raise rates to around 3%, and even that may be a bit optimistic on the high side unless economic growth and inflation picks up.


Leave A Comment