
The EUR/USD consolidated its losses and is looking for a new direction. In order to stage a recovery and not only a dead-cat bounce, there are some hurdles to cross.
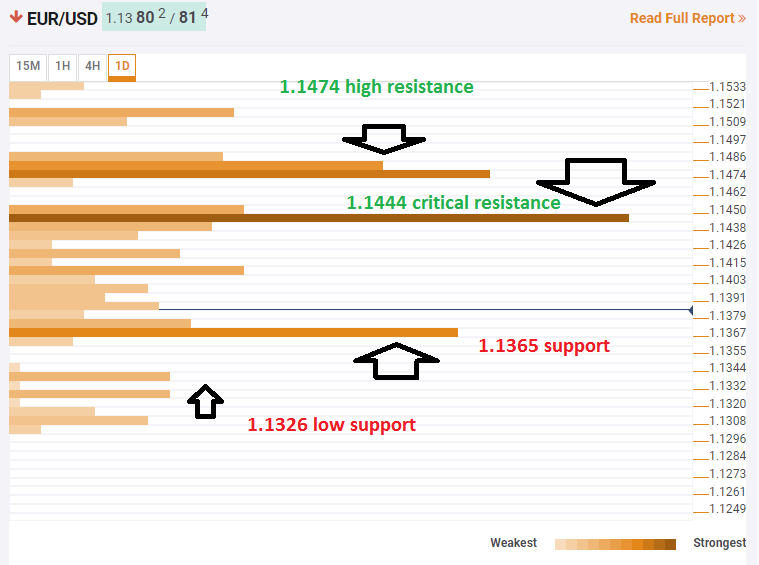
The Technical Confluences Indicator shows that the 1.1444 is a convergence of potent technical lines: the Fibonacci 161.8% one-month, the Bolinger Band 4h-Middle, and the Bolinger Band one-day Lower. We also find Fibonacci 23.6% one-week just above.
A break will open the door to another resistance line close by 1.1474which is the confluence of the Pivot Point one-month Support 2, and the Pivot Point one-day Resistance 2.
Support is at 1.1365 which is the meeting point of the recent 2018 low, the Pivot Point one-month Support 3, and the PP one-day Support 1.
Further down, there are very few support lines with one noteworthy point at 1.1326 which is the Fibonacci 161.8% one-day.
Here is how it looks on the tool:
Confluence Detector
The Confluence Detector finds exciting opportunities using Technical Confluences. The TC is a tool to locate and point out those price levels where there is a congestion of indicators, moving averages, Fibonacci levels, Pivot Points, etc. Knowing where these congestion points are located is very useful for the trader, and can be used as a basis for different strategies.
This tool assigns a certain amount of “weight” to each indicator, and this “weight” can influence adjacents price levels. These weightings mean that one price level without any indicator or moving average but under the influence of two “strongly weighted” levels accumulate more resistance than their neighbors. In these cases, the tool signals resistance in apparently empty areas.


Leave A Comment