Initial Projection Reached
(Short-Term Top Expected )
Market Overview
A strong up-thrust from 1872 took SPX all the way to the previous top of 2020, where it is at least likely to consolidate. There are several good technical reasons for that! First, it met a projection to 2016-2022 which originated from the base built between 1872 and 1926. Next, at Friday’s close, negative divergence was apparent in the daily and hourly A/Ds. Finally, this level is fraught with considerable resistance which should repel a short-term overbought condition. This should be enough to generate a period of consolidation, at a minimum.
What, exactly is the significance of all this strength? We should find out over the next few days or weeks. On the P&F chart, the pattern of the move from 1872 is very similar to the one which was generated after the first correction, at the end of August. That one was followed by a fairly deep correction and then a volatile and choppy move to 2020. It’s possible that, for the present move, this is where the similarity will end. But the path of the index from here on should be fairly easy to follow. I will show you why in the analysis section.
Intermediate Indicators Survey
The weekly MACD has turned up, but at -30.19, it remains very oversold.
The weekly cumulative A/D line had a good rally.
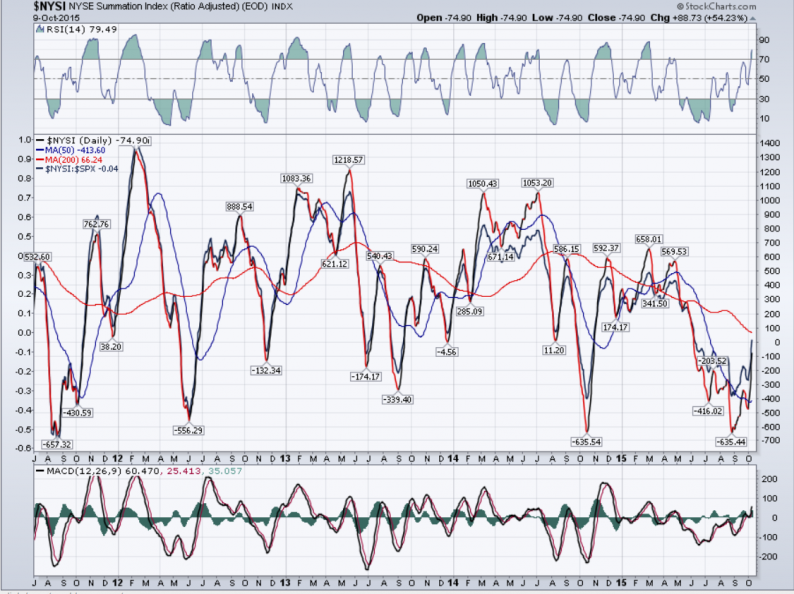
So did the NYSI (courtesy of Stockharts.com) which was very oversold. It has surpassed its former near-term high and re-established a short-term uptrend.
The 3X P&F chart appears to have filled its full count from the base formed above 1872, although one could come up with a possible extreme count to 2040.

Chart Analysis
Daily SPX chart (courtesy of QCharts.com, as well as others below).
Las week, I mentioned that the SPX had possibly shifted its primary trend to a large sideways channel which was delineated by the brown trend line drawn across its last two tops with a parallel starting at the October 2014 low. I also mentioned that in order to show that it had, instead, started a full-blown intermediate trend, it would have to break below the lower channel line. This has not happened, yet. Instead, prices staged a strong rally after touching it on 9/29. Obviously, the index is not ready to move through it at this time, but that does not mean that it won’t be after some additional distribution. The question is now whether or not we are ready to change the pattern to a new uptrend, or simply to trade sideways for a while and then go through. How about something in between? Just as it was premature to expect SPX to break below 1867 this early, making a new high may not be in the cards for quite a while.


Leave A Comment