
Q2 GDP growth was revised higher from 4.1% to 4.2% even though the estimate for real consumption growth was revised lower from 4% to 3.8%. That being said, the consumer had a strong rebound from Q1 and still drove GDP growth to an amazing result. The obvious question is whether this growth rate will continue. The first official data which tells us if the economy remained on the right track is the July Personal Income and Outlays report which gives us information on real income, real consumption, and inflation.
Real Income Growth Is Strong
The results from this report were largely in line with estimates which is great news because personal income and consumption growth were steady while inflation remained low. This is an extension of the Goldilocks economy which has been in place since late 2016 which has allowed U.S. equities to rally higher. Month over month real disposable personal income growth was 0.3% which met estimates and was down 0.1% from June. On a year over year basis, growth fell about 7.5 basis points to 2.9%.
Real disposable personal income growth is clearly calculated differently from real wage growth since real wage growth is negative. One main difference is real wage growth is commonly deflated by CPI which is higher than PCE. Income also isn’t the same as wages. Wages is pay from a job, while income can be earnings from anything such as proprietor income and personal interest income. It’s debatable which measurement is more important. It certainly looks like real income growth is more relevant in the current economy because the Conference Board consumer confidence report showed consumers are the most confident since 2000. That’s consistent with stable real income growth and inconsistent with negative real wage growth.
The chart below shows 5 year annualized real personal income growth net of government transfer receipts.
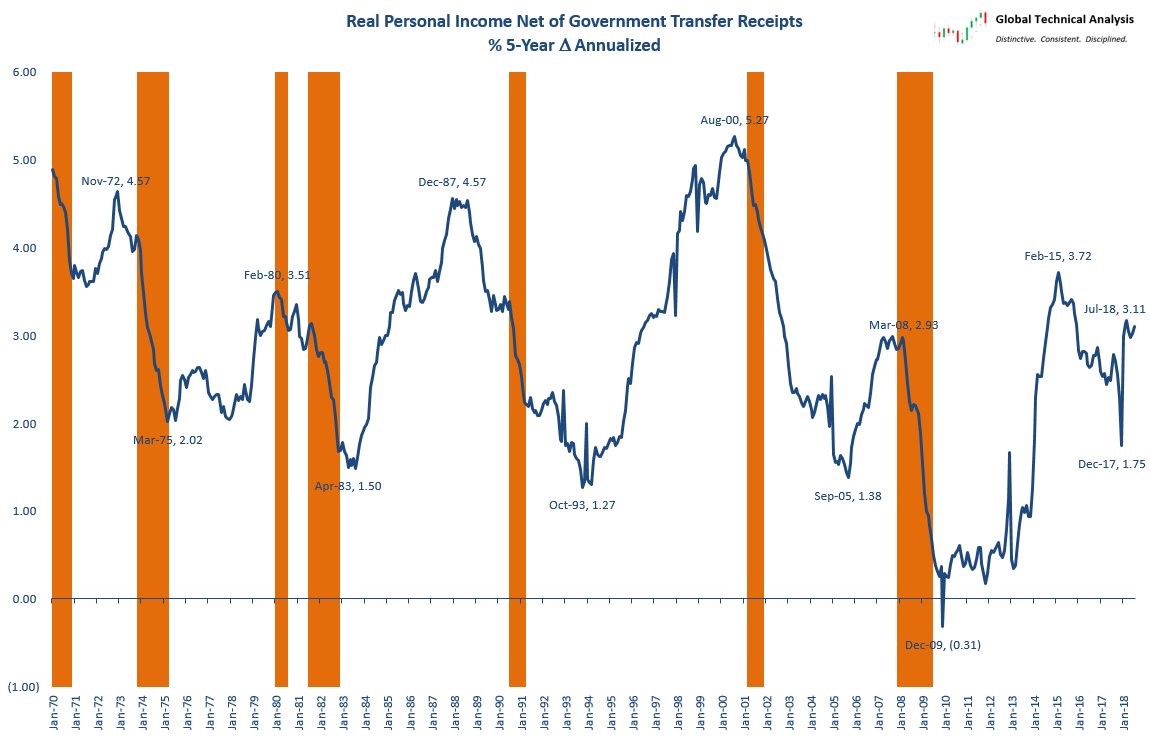
Source: Twitter @Techs_Global


Leave A Comment