While dramatic turns and surprises may make for great reality television and may be very helpful for media ratings, they are less than ideal in the markets. We’re now getting a lot of bombshells out of Washington, D.C., and it is becoming increasingly difficult to think that the pro-growth policies and “Trump agenda” are not at risk.
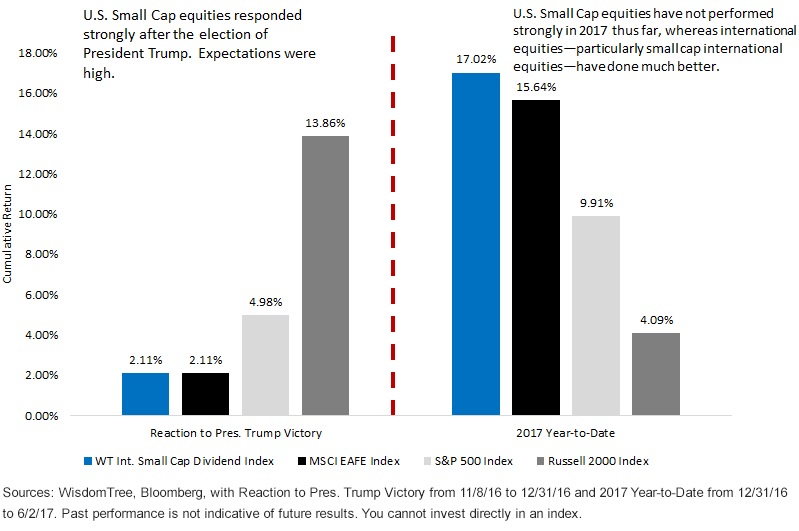
Trump Reflation Trade vs. What’s Worked in 2017

For definitions of indexes in the chart, visit our glossary.
Year-to-Date Reversals1
The Russell 2000 Index was a rather dramatic market signal that showcased a strong response to President Trump’s November 8, 2016, victory, and there were a number of supportive catalysts for U.S. small-cap stocks after the election and at the end of the year. Rising rates—specifically, a rising U.S. 10-Year Treasury note yield—were driven by increasing growth expectations, something typically quite bullish for small-cap stocks. Additionally, corporate tax reform was seen as very possible given Republican majorities in both the U.S. House of Representatives and the Senate, and small-cap stocks tend to pay higher effective tax rates than large-cap stocks, thereby benefiting more from lower statutory rates. Also, the Bloomberg Dollar Index—a measure of the performance of the U.S. dollar against a diversified basket of currencies—was up 5.7% from November 8, 2016, to December 31, 2016. Since small caps derive the vast majority of their revenues from inside the U.S. rather than outside, this was yet another reason why the Russell 2000 Index did so well. In fact, there were 15 days in a row of positive gains on this index, the longest such streak since 1996.2
As of this writing (June 2, 2017):
The U.S. 10-Year Treasury note interest rate has fallen since the start of 2017 from 2.44% to 2.15%.
The Bloomberg Dollar Index is down 5.8%.
With each passing week, it is looking more and more challenging for corporate tax reform to be completed in 2017.


Leave A Comment