
Today’s release of the June Producer Price Index (PPI) for Final Demand came in at 0.1% month-over-month seasonally adjusted, up from last month’s 0.0%. It is at 2.0% year-over-year, down from 2.4% last month, on a non-seasonally adjusted basis. Core Final Demand (less food and energy) came in at 0.31% MoM, down from 0.3% the previous month and is up 1.9% YoY. Investing.com MoM consensus forecasts were for -0.1% headline and 0.2% core.
Here is the summary of the news release on Final Demand:
The Producer Price Index for final demand increased 0.1 percent in June, seasonally adjusted, the U.S. Bureau of Labor Statistics reported today. Final demand prices were unchanged in May and rose 0.5 percent in April. (See table A.) On an unadjusted basis, the final demand index advanced 2.0 percent for the 12 months ended in June.
In June, almost 80 percent of the rise in the final demand index is attributable to prices for final demand services, which increased 0.2 percent. The index for final demand goods edged up 0.1 percent.
Prices for final demand less foods, energy, and trade services increased 0.2 percent in June. For the 12 months ended in June, the index for final demand less foods, energy, and trade services advanced 2.0 percent. More…
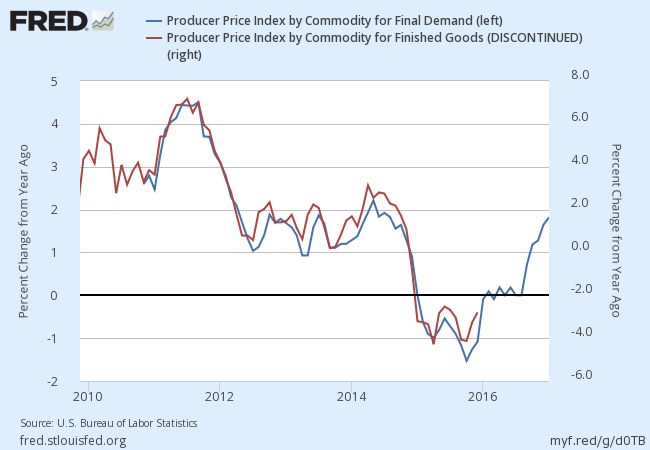
Finished Goods: Headline and Core
The BLS shifted its focus to its new “Final Demand” series in 2014, a shift we support. However, the data for these series are only constructed back to November 2009 for Headline and April 2010 for Core. Since our focus is on longer-term trends, we continue to track the legacy Producer Price Index for Finished Goods, which the BLS also includes in their monthly updates.
As this overlay illustrates, the Final Demand and Finished Goods indexes are highly correlated.
FRED® Graphs ©Federal Reserve Bank of St. Louis. All rights reserved.
Now let’s visualize the numbers with an overlay of the Headline and Core (ex-food and energy) PPI for finished goods since 2000, seasonally adjusted. The plunge that began in mid-2014 in headline PPI is, of course, energy related. It is now off its interim low set in April of 2015. Year-over-year Core PPI, now at 1.7%, has trended lower from its 2.3% interim high also set in 2015.


Leave A Comment