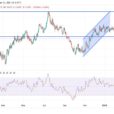
Click on picture to enlarge

Many feel investors should “listen” to the message coming from Junk Bonds, due to them sometimes being a leading indicator for the stock market. The 2-pack above takes a look at the two largest Junk Bond ETF’s. (JNK) and (HYG) could be breaking 5-year support, as they have been a little soft of late, while the S&P 500 has hit all-time highs. Another way to look at Junk Bonds is to look at yields versus prices.
The chart below comes from Federal Reserve of St. Louis.
Click on picture to enlarge

When yields started moving higher back in 2000 & 2007 (upper left chart), junk bonds and the S&P 500 turned soft. From 2011 to a few months ago, yields continued to fall, which is often a good message for stocks.
The lower right chart reflects that yields have recently turned higher, breaking above a falling resistance line. Are Junk Bond ETF’s sending an early cautionary message to the stock market? I DO NOT believe that investors should adjust portfolios solely upon the action of junk bonds.


Leave A Comment