Let me tell you something you should maybe watch for in 2018. You should maybe watch for days when everything falls apart simultaneously.
That’s pretty intuitive right? When everything goes to hell in a handbasket – as opposed to just one or two things going to hell in a handbasket – well then you’ve got a problem.
Think about it this way. If you get T-boned by a speeding pickup truck going through an intersection on your way to work but your boss gives you a 50% raise when you finally limp into the office on your one remaining good leg, you can look back at the end of the day and say it wasn’t all bad. But if you get T-boned by a speeding pickup truck going through an intersection on your way to work, and then your boss fires you for being late, and then you get knifed at the bus stop trying to get home (remember, your car was destroyed that morning), well then that was an all around s*&%y day.
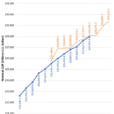
Now think about that in the market context. As Bloomberg’s Luke Kawa writes on Friday, banks, big-cap tech, and the energy ETF only saw two sessions in which all fell by 1% during 2017. As Luke notes, that’s “compared to 14 such instances in 2016 and 20 in 2015.”
I made a chart that illustrates this:

Incidentally, those days correspond to the aftermath of “fire and fury” and to the rumor that Gary Cohn was on the verge of resigning.
The rotation apparent in the absence of coordinated, across-the-board moves lower is one of the factors keeping a lid on vol. Let’s bring in JPMorgan’s Marko Kolanovic:
Record low correlations between stocks are very likely to increase after the tax reform gets fully priced-in in the second half of 2018. We estimate this will push index volatility up by ~3 points. Perhaps the best example of the impact of correlation on reducing S&P 500 volatility was the market move on Nov 29, when financials and technology stocks moved ~4% relative to each other leaving the S&P 500 index price unchanged (~5 sigma move).


Leave A Comment