Here is a brief review of period-over-period change in short interest in the March 16-29 period in nine S&P 500 sectors.
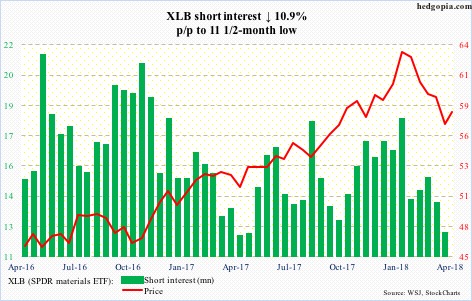
XLB (SPDR materials ETF)

After remaining under the 200-day moving average since March 22, XLB (57.99) retook the average Tuesday but merely by a penny. The journey toward at least the 50-day (59.27) becomes easier if 58-58.50 gives way – which is likely. This was preceded by defense of support at 55-56. In the right circumstances, the weekly chart has plenty of room to head higher.
XLE (SPDR energy ETF)
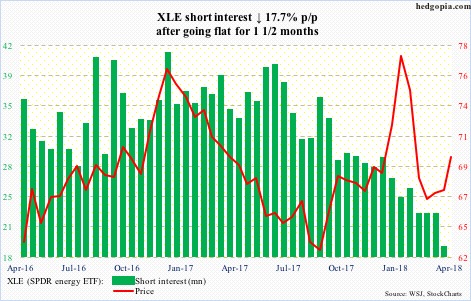
After a sharp decline between late January and early February, XLE (69.91) essentially went sideways around the 200-day – between 66.60 and 68.70 – until Tuesday when it rallied past both the 50- and 200-day. Nearest resistance lies at 70.45.
Shorts continue to cut back.
XLF (SPDR financial ETF)
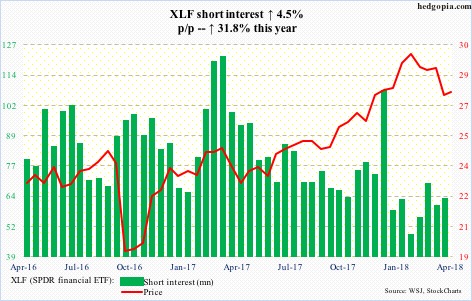
Subsequent to getting rejected at the 50-day 13 sessions ago, XLF (27.73) came under pressure, but, kudos to the bulls, the 200-day was defended. Ditto with support at just under 27, a loss of which could potentially begin a new round of selling.
Weekly momentum indicators are oversold. That said, there is work ahead for the bulls. The last four sessions have produced candles with topping tails.
XLI (SPDR industrial ETF)
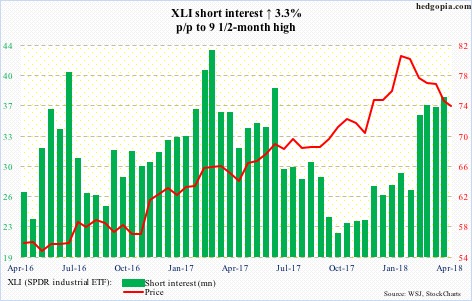
XLI (73.66) shorts have gotten aggressive in recent weeks. Even if a squeeze occurs, the ETF remains in a downtrend until it breaks out of 77, which represents a falling trend line from late January.
Tuesday, it rallied 1.5 percent, but it came in a long-legged doji session. Several times over the past couple of weeks, rally attempts got rejected at 75-76. That is the level to watch for now.
XLK (SPDR technology ETF)
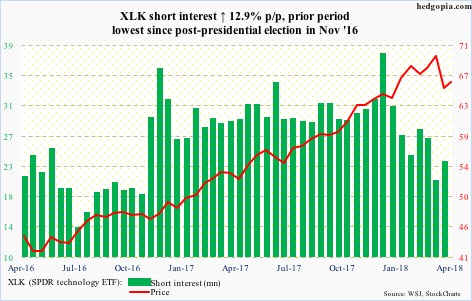
As are several other sector ETF’s as well as equity indices, XLK (66.14) lies in the middle of the 50- and 200-day. A test of the former (66.89) is probably just a matter of time. In the ideal circumstances, the bulls would like to go test 69, where a false breakout occurred a month ago.


Leave A Comment