
Here is a brief review of period-over-period change in short interest in the September 17-28 period in nine S&P 500 sectors.
XLB (SPDR materials ETF)

XLB (55.70) fell out of a slightly rising ascending channel last week. This preceded rejection at resistance at 61-plus three weeks ago. Both the 50- and 200-day have been lost. The ETF is teetering on support at just south of 56.
XLE (SPDR energy ETF)
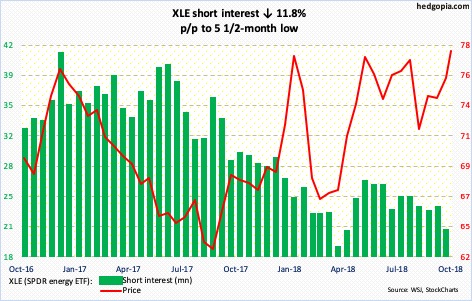
XLE (77.79) rallied two percent during the reporting period. Short interest dropped 11.8 percent. Resistance at 77-78 is being tested, but bulls have expended a lot of energy in the past month as the ETF rallied eight-plus percent. The daily chart is overbought.
XLF (SPDR financial ETF)

With major banks and brokers due to report 3Q18 on Friday and next week, XLF (28.08) sits right underneath the 50- and 200-day (both flat). The ETF has struggled to rally along the recent steepening in the Treasury yield curve (10s/2s).
XLI (SPDR industrial ETF)

Shorts got a little aggressive in September, and have been rewarded. XLI (77.91) peaked at 80.41 on September 20 and has since made lower highs and lower lows. A trend line from July has been broken. The 50-day lies at 77.55, followed by decent horizontal support at just south of 77.
XLK (SPDR technology ETF)
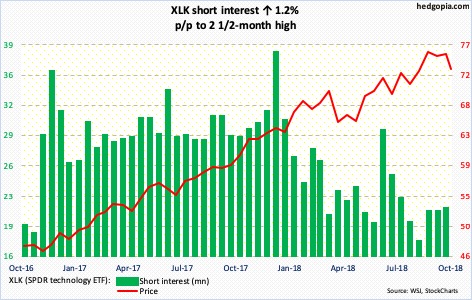
Last week, XLK (73.05) developed a weekly bearish engulfing candle. This Monday, it sliced through its 50-day, with defense of 72 Tuesday. It is literally sitting on a rising trend line from February. This is a must-save for the bulls. Weekly momentum indicators have ways to go before overbought conditions are unwound.
XLP (SPDR consumer staples ETF)

On September 20, XLP (54.06) was rejected at resistance north of 55. The subsequent decline had it test both the 50- and 200-day. Buyers showed up last week at/near the 200-day, even as some selling showed up at the 50-day Tuesday. Resistance at 55-55.50 goes back two-plus years.


Leave A Comment