
Many investors rely on indicators to help them understand the market action.
Some indicators measure momentum. They help time buy and sell signals in individual stocks. Other indicators provide a broad view of the stock market.

Breadth indicators measure how many stocks are participating in a price move. They aren’t as popular as momentum indicators, but they are more useful.
An example of a breadth indicator is the percentage of stocks trading above their 200-day moving average (MA). This shows whether more stocks are in an uptrend or a downtrend.
Breadth measures the trend for a group of stocks, like the ones in the S&P 500 Index. The chart below shows that indicator.
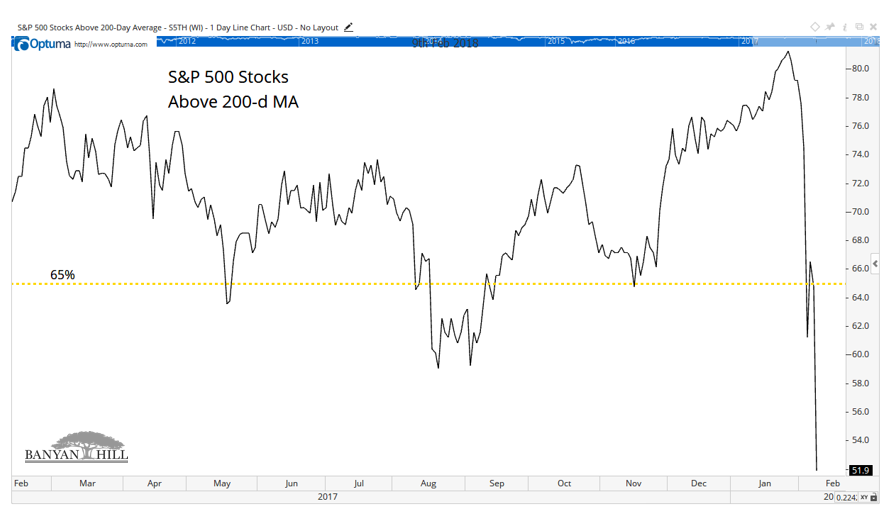
By definition, a stock is in an uptrend when it’s above its 200-day MA. A stock is in a downtrend when it is below its 200-day MA.
In the past, when the percentage of stocks in the S&P 500 that are above their 200-day MA fell below 65%, the stock market has been in trouble.
Well, that’s where we are now. Barely more than half of the stocks are above their 200-day MA.
This Is a Warning Sign
Over the past 10 years, being out of the market when this indicator is below 65 avoided steep losses.
The maximum decline for the S&P 500 while the indicator was above 65 was 14.2%. When the indicator was below 65, the largest loss in the index topped 55%.
This doesn’t mean you should sell all of your stocks and sit in cash. There will be winners in any market. But in a bear market, expect less than 20% of stocks to be winners.
With breadth bearish, now is not the time to buy stocks without careful research.


Leave A Comment