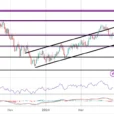
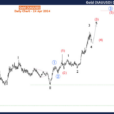
I shot this photo using my iPhone, while on a whale watching boat.
The boat took us on the Pacific Ocean about an hour north of Puerto Vallarta.
Last week, I compared Semiconductors (SMH), not only to Wonder Woman, as I have done many times before, but also to a mermaid.

After all, she flies and she swims.
The market’s last rally is because of her super powers.
However, I also queried about how long SMH would hold up.
Furthermore, if SMH faltered I wondered, what would be the ramifications for the rest of the market.
In my allegorical way, I wrote, “Wonder Woman might have the power to transform into an amphibian and navigate the deep ocean, but what happens if she runs into Moby Dick?
Today, Semiconductors spotted the whale.

Before we speculate if like Captain Ahab, the whale turns out as her demise, let’s review the potential topping pattern.
A reversal pattern, in its most classic sense, begins with a new multi-month or longer high.
SMH made a new all-time high.
Then, it must close within 25% of the intraday low.
SMH closed within that range.
Lastly, it needs a second day confirmation with a close beneath the prior day low.
That is the unknown factor until tomorrow’s close.
On the chart, you see today’s high 114.55 and the low 111.03. The price settled at 111.49.
Typically, should reversal tops confirm, they are stronger if the volume is better than the average daily volume. With over 5.5 million shares traded a day, today’s volume ws nearly 7 million shares.
Secondly, a confirmed reversal pattern can yield a 5-10% decline from the highest price. Sometimes, the high price before the reversal, yields the ultimate top.
That measures to a move down to anwhere from 106-103.
The blue line is the 50-DMA. That means we could stop there (right around the measured move), break below it, or find support at around 105.74 or the low from March 5th.
Regardless, SMH is important to the near-term move in the overall market.


Leave A Comment