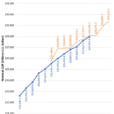
Some analysts called for the final low of the correction to have occurred on 4/02, at 2554. I have been reluctant to do this for two principal reasons: 1) The 40-wk. cycle low is still ahead of us — ideally due to bottom sometime in May, and 2) there is an unfilled valid count to 2450 on the SPX.
With this past week’s market action, the market direction appears ready to be moving to the downside again, and if we start a decline that continues for another four to six weeks into the cycle low, considering the degree of volatility currently present in the market, it is not too far-fetched to conceive of another (and final) leg of the correction descending to the above-mentioned level. Of course, the market action will have to confirm this possibility, and we should know as early as next week if it has a chance of materializing.
I had expected the weakness to begin last week because of the minor cycles due at the end of the past week and into the beginning of the next. The first cycle bottomed on Wednesday but had little effect on prices and extended the bounce for a couple of days. The second did bring prices down 34 points from the high when it bottomed right on cue at the end of the day. The third, which could bottom as late as Wednesday, may be the charm to start the anticipated pull-back. If the 40-wk cycle takes over from there, then look for protracted lower prices ahead.
Chart Analysis (These charts and subsequent ones courtesy of QCharts)
SPX daily chart
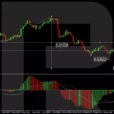
On the daily SPX chart, I have drawn a downside channel which could represent the basic trend pattern for the next few weeks. Here is the analysis which supports this view, starting with the two primary points that were made in the Market Overview. There is an important cycle low due during May. It is most likely that the index will not be able to start a bullish uptrend until that low is out of the way. To those who are familiar with Point & Figure analysis — AND cycles – the combining of these two analytical studies often affords us an uncanny time/price preview. The congestion pattern which produced a count taken at the 2760 level gives us a target of 2450. These two factors should influence the behavior of the index over the next few weeks. If so, it should already be apparent in the chart pattern.


Leave A Comment