
If you have been following our analysis and research of the Crude Oil trend and the energy sector, you know we’ve been suggesting Crude would attempt a move lower and attempt to retest the $58~63 level. It appears the breakdown in prices has begun.
Our research team uses an array of proprietary technology, price modeling tools and price cycle modeling tools to attempt to keep our followers up to date with trend reversals, trend expansions and more. This recent downside price move is something we have been expecting for the last 20+ days. The breakdown of support in the Crude oil market, as well as the oversupply of oil on the planet, is setting up for a downside move that could be extraordinary.
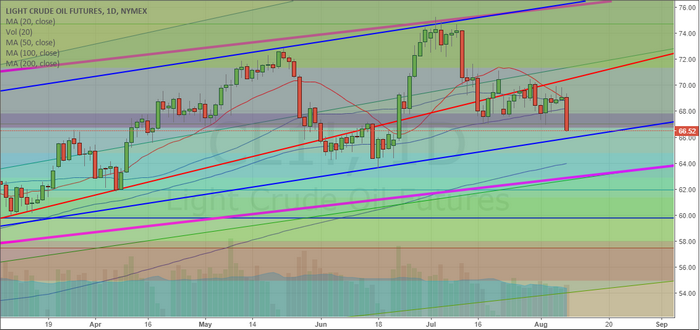
This Daily Crude Oil chart shows some of our trend following work where we attempt to identify break ranges, channels, Fibonacci levels and other advanced technical analysis studies. The daily chart only shows a shorter time span and is perfect for attempting to identify immediate support or resistance levels for the price. One can see from this chart that the current breakdown in price is attempting to breach a number of key Fibonacci levels. Should the $66.50 level be broken, we would expect Crude prices to fall to near $64.75 or $62.90. These are the next support levels below the current Fibonacci levels.
The Blue and Magenta levels on this chart are price channels that will become more evident on the next chart – the Weekly chart.
This Weekly Crude Oil chart provides a better, longer-term, perspective of the Oil market. We can see from this chart the Magenta price channel originates from 2016 price rotation. The Blue price channel originates from early 2018 price rotation. The lower, Red, support level originates from the low in June 2017. All of these play an important role in understanding how the price is breaking free of these price channels and may attempt to move dramatically lower.


Leave A Comment