
Well, oil’s explosive rally recently has been a thorn in my side (although the Nasdaq’s weakness has helped balance it out). I wanted to take a look at recently counter-trend rallies in oil and see if there might be any insights to be drawn. I have one…
It seems to me, looking at recent history, that these idiotic, wrong-headed rallies last for thirteen days before reversing. Now I realize a sample set of two isn’t exactly mind-blowing, but what else ya gonna do? Just take a wild guess? Thus, if this pattern holds, oil has the rest of this week to keep pushing higher before it finally rolls over yet again.
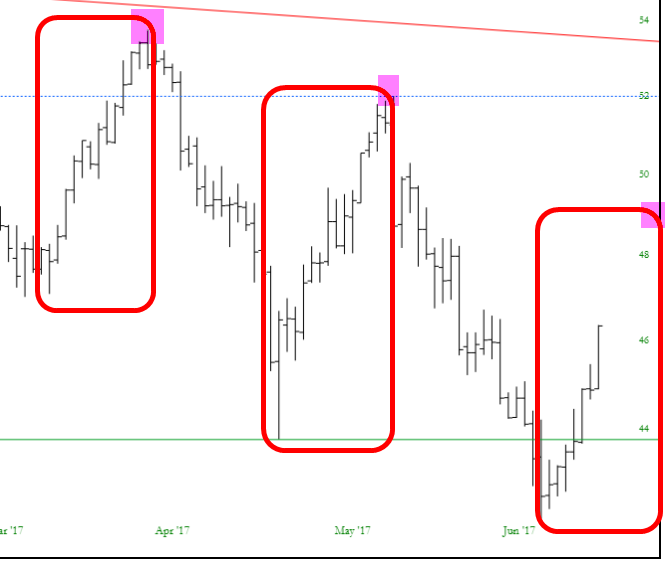
One thing to note about the chart above……it does NOT include today’s action (which is another big up bar). I love SlopeCharts, but one limitation is that futures data is end-of-day only at this point, so I wanted to be really clear that one “day” is not present in what you see above.


Leave A Comment