2017 Was The Perfect Year?
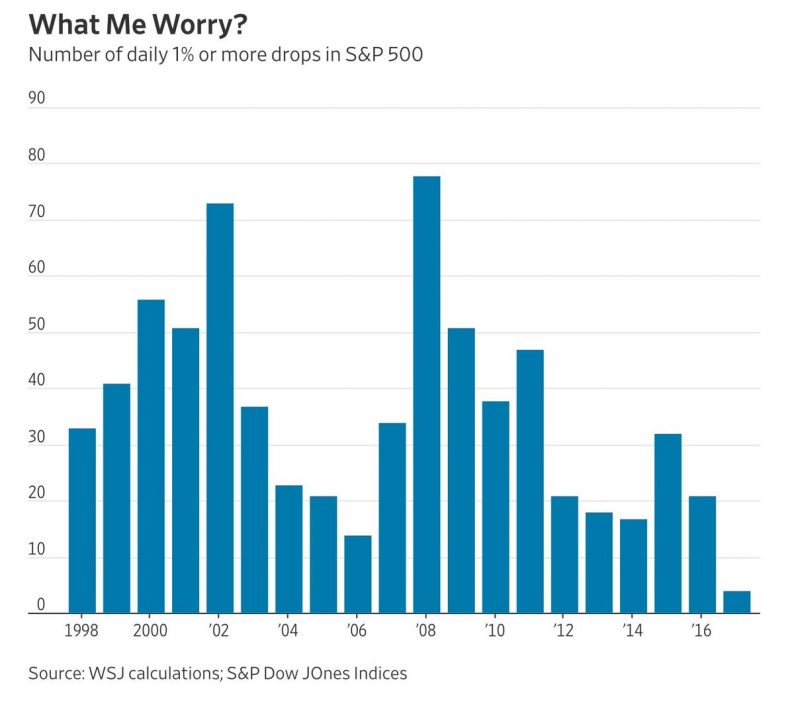
With bitcoin falling 45% from its peak in just a few days, stock investors are still sitting pretty as there have only been four 1% daily selloffs in the S&P 500. As you can see from the chart below, this is by far the lowest amount of daily 1% selloffs in the past 20 years. Even when stocks were at the end of their best rally ever in the 1990s, stocks were never this placid. This chart shows how each year can be different from the last year as volatility is far from permanent. In the past 30 years, there have been 1% selloffs every 7 or 8 days. Back in the fall of 2008, a 1% selloff was a nice day. In the past 3 decades, a 2% selloff has occurred 10 times a year on average, meaning there have been less 1% selloffs this year than there are usually 2% selloffs.
One of the questions traders have is if the algorithmic trading functions are creating smoothing. While that’s possible, it’s tough to think there has been that large of a difference between this year and 2015 which had 32 1% selloffs. The only way to tell for sure is to see how the next few years play out. Personally, I think that there are always predictions that the current market action will continue because of structural issues. Then we see a snapback to realty and those guesses prove to have been fruitless. It’s like how some questioned if unemployment could ever fall below 5% again when it was in the double digits a few years ago. Some people think that cryptos can’t go down. We have recently seen how ridiculous that notion is.

Very Low Unemployment In Some Cities
Measuring the unemployment rate in such a large country and then using it to make policy can be fruitless because of the sharp gradient among various regions. In America, some areas in the Midwest haven’t participated as much in the expansion. Another example of this is how Sicily hasn’t experienced the economic recovery that Italy and the rest of Europe have. As I mentioned, the unemployment rate has fallen significantly this business cycle as it’s now at 4.1%. The chart below shows the unemployment rates of some of the top American cities. As you can see, Boston, San Francisco, and Dallas have a 3% or lower unemployment rates. That’s probably very close to the minimum unemployment rate. The problem is that by the time Detroit starts to catch up, these cities see very high wage inflation. Detroit still has an unemployment rate of 9.6%. To be clear, not all areas in the Midwest are struggling. For example. Fargo, North Dakota has an unemployment rate of 1.6% because of the energy jobs. Indiana neared the lowest unemployment rate ever as it fell to 3% in June; now it’s at 3.9%.


Leave A Comment