Latest Price – $139.20.
Daily Chart

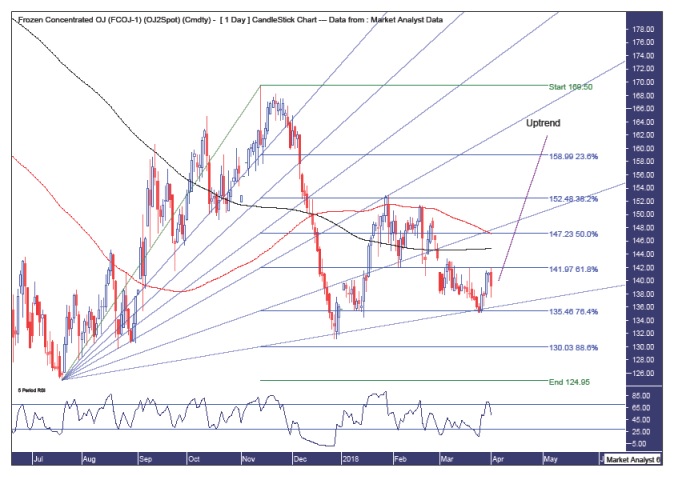
Pattern – price looks to be generally in an uptrend with a secondary low in place with a recent test of that higher low turning price back up.
Fibonacci – the higher low was just above the 88.6% retracement level which is normal for the first correction in a new bull market as first corrections often make deep retracements while the most recent low looks to have found support at the 76.4% level. The higher low was at support from the 88.6% angle and price looks to have once again found support at that angle.
Moving averages – in a bullish position with the 100-day moving average (red) above the 200-day moving average (black).
RSI – marginally in positive territory just above the 50 level and that may be where price takes off again to the upside.
Monthly Chart

Pattern – a downtrend has been in force since 2016 high and I 1believe the current price action to be corrective in nature.
Bollinger Bands – the middle band has been providing resistance but I believe price can bust above there, if only temporarily. Price may even reach the upper band which should act as strong resistance if and when it gets there.
Fibonacci – The low after the 2016 high was at support from the 76.4% retracement level so there is definitely potential for that to be a major higher low. The high after that low was at resistance from the 50% level and breaking above that level would look bullish. The major low was around support from the 76.4% angle and price is once again there low and I expect support to come in once again. I am targeting price to get back up to the 61.8% angle which should provide stiff resistance.
RSI – still in a weak territory. Having said that, there is plenty of room to the upside.
Summing up – bullish at current levels, looking for a solid rally which I am viewing as a bear rally only.


Leave A Comment