The Q Ratio is a popular method of estimating the fair value of the stock market developed by Nobel Laureate James Tobin. It’s a fairly simple concept, but laborious to calculate. The Q Ratio is the total price of the market divided by the replacement cost of all its companies. Fortunately, the government does the work of accumulating the data for the calculation. The numbers are supplied in the Federal Reserve Z.1 Financial Accounts of the United Statesof the United States, which is released quarterly.
Extrapolating Q
The ratio subsequent to the latest Fed data (through 2017 Q4) is based on a subjective process that factors in the monthly closes for the Vanguard Total Market ETF (VTI).
Unfortunately, the Q Ratio isn’t a very timely metric. The Z.1 data is over two months old when it’s released, and three additional months will pass before the next release. To address this problem, our monthly updates include an estimate for the more recent months based on changes in the VTI price (the Vanguard Total Market ETF) as a surrogate for Corporate Equities; Liability.
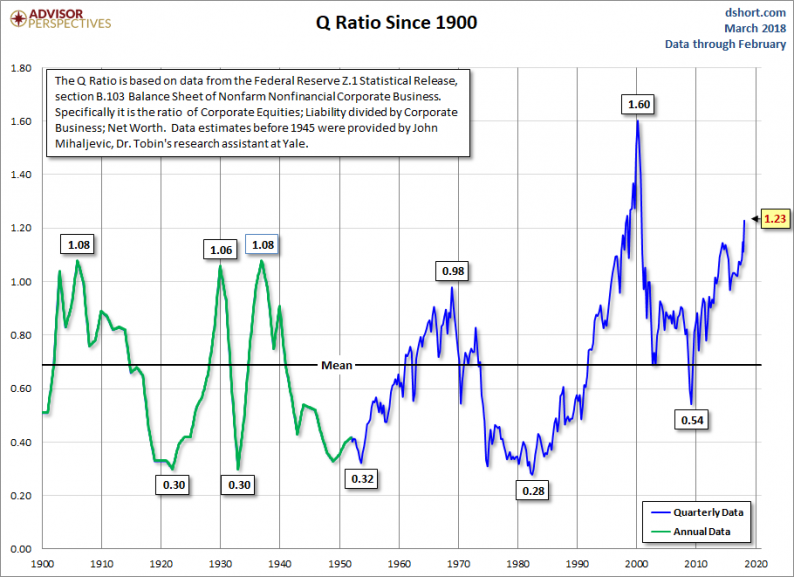
The first chart shows Q Ratio from 1900 to the present.

Interpreting the Ratio
The data since 1945 is a simple calculation using data from the Federal Reserve Z.1 Statistical Release, section B.103, Balance Sheet and Reconciliation Tables for Nonfinancial Corporate Business. Specifically, it is the ratio of Market Value divided by Replacement Cost. It might seem logical that fair value would be a 1:1 ratio. But that has not historically been the case. The explanation, according to Smithers & Co. (more about them later) is that “the replacement cost of company assets is overstated. This is because the long-term real return on corporate equity, according to the published data, is only 4.8%, while the long-term real return to investors is around 6.0%. Over the long-term and in equilibrium, the two must be the same.”


Leave A Comment