
A good bit has happened over the last couple of weeks. The S&P 500 (SPY) staged a sharp recovery from February closing lows due to repeated Central Bank actions during the month as well as an expected reflex rally fueled by short-covering. On a short term basis, the technical backdrop has improved markedly, but was it enough to change the longer-term trend of the markets from bearish back to bullish. This is the topic we will directly tackle this week.
While allocations have been very conservative since last May, avoiding the ensuing volatile declines last summer and the start of this year, I have repeatedly stated that interventions by Central Banks could nullify the “bear case” in the short-term.
Let’s start with a short-term (daily) view and update the previous observations.
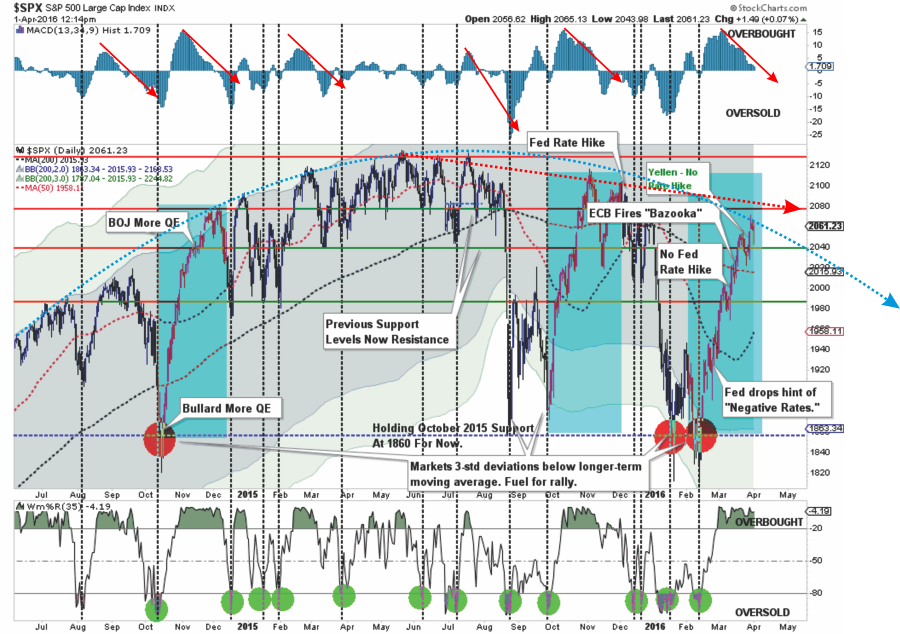
I have added some notations for the flurry of Central Bank activity that has occurred recently to push the markets higher.
1. The shaded areas represent 2 and 3-standard deviations of price movement from the 125-day moving average. I am using a longer-term moving average here to represent more extreme price extensions of the index. The last 4-times prices were 3-standard deviations below the moving average, the subsequent rallies were very sharp as short positions were forced to cover. This was the same action that we saw during the current rally.
2. The top and bottom of the chart show the overbought/sold conditions of the market. The recent rally has responded as expected from recent oversold conditions. With the oversold condition now exhausted, the potential for further upside has been greatly reduced. I have notated with red arrows that when this overbought condition reverses it has marked the end of the previous rally going back to 2014.
3. The red dashed line shows the current descending trend lines that continue to provide resistance to the advance. While the recent advance is now challenging that downtrend line, the collision of resistance levels may prove a challenge to a further advance from current levels. The arching dashed blue line shows the change of overall advancing to now declining price trends.
A Potential “Buy” Signal Approaches
By the time “buy” and “sell” signals are triggered, the initial recovery has already completed most of its initial move. This is completely expected. Importantly, if the markets are indeed reversing course, the entry back into the markets will still be very early into the next overall advance.
The importance of waiting for confirmation of a change in market dynamics, even for shorter term traders, is to establish a higher reward-to-risk ratio when putting investment capital to work. This methodology, while you will not“buy the bottom” or “sell the top,” reduces the probability of speculating incorrectly and then becoming emotionally trapped into a position that becomes detrimental to portfolio performance.
In the chart below, you will note that the previous rallies which took the markets to very overbought short-term conditions (top part of the chart). However, those rallies did not reverse the sell-signal in the lower part of the chart.Each of these previous rallies subsequently failed taking stocks lower. This is why the allocation model remained exposed to lower levels of equity risk during this entire period.

Currently, as shown above, the short-term dynamics of the market have improved sufficiently enough to trigger an early “buy” signal. This suggests a moderate increase in equity exposure is warranted given a proper opportunity.However, to ensure that the current advance is not a “head-fake,” as repeated seen previously, the market will need to reduce the current overbought condition without violating near-term support levels OR reversing the current buy signal.
Again, let me reiterate, the commentary above is for shorter-term, active investors, looking for a set up to take on equity risk. There is currently a HIGH PROBABILITY that the analysis above will be reversed in very short-order.
As a portfolio manager for individuals retirement assets, where risk must be substantially mitigated, there has been NO improvement in the intermediate technicals of the market currently.
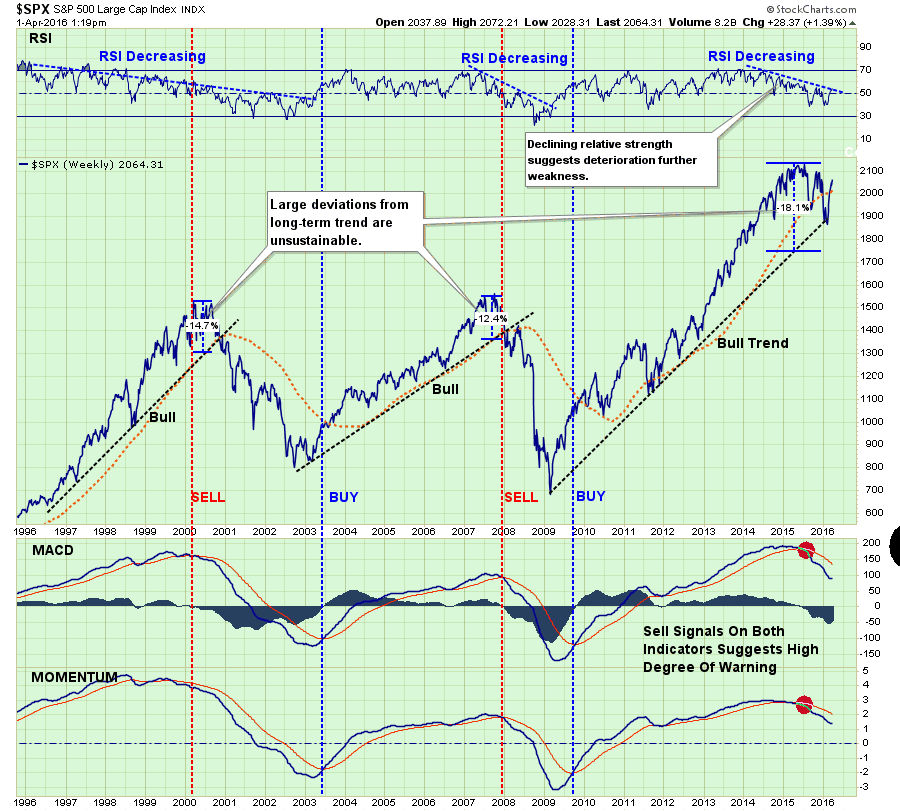
With relative strength, momentum and price deterioration still on the decline, there is currently little reason to become aggressively exposed to market risk. This is particularly the case given the extreme technical similarities to previous major market peaks.
Furthermore, if the “bulls” have indeed returned to the market, as is being suggested by the mainstream media, we should see longer term measures of market momentum and relative strength turning more positive as well.


Leave A Comment