
The S&P 500 Index edged up to another record high yesterday (Sep. 13), providing another reason to wonder: How long can this last? Mere mortals are clueless, but in the search for some historical perspective, it’s reasonable to consider how the current bull run stacks up against its predecessors.
Minds will differ on how to measure and date bull markets. A popular definition (as recently profiled here by First Trust, for example) is to track the S&P 500 from its lowest close reached after the market has dropped 20% or more to the next market peak. But one might ask: Why 20% vs. 25%, or 19.8%?
As an alternative that’s arguably less subjective, let’s review how the S&P fares after US recessions have ended, as dated by NBER.org. The logic here is that economic expansions fuel bull markets and so it’s reasonable to measure market recoveries after a period of macro contraction ends.
Using that definition, let’s review how the S&P 500 has performed during the last ten economic recoveries. To be precise, the birth of the stock market’s bull market is dated as the first day after a NBER-defined recession has ended. The market run continues through the peak.
For example, the 2001 recession ended in November of that year and so the first date of the equity bull market is Dec. 1, 2001, and ended on Dec. 31, 2007, the NBER’s dating of the economic peak before the next recession began.
The current bull market began on July 1, 2009, the first day after the 2008-2009 recession ended in June 2009. As the chart below shows, the bull run currently in progress (red line) is the third-longest since the mid-1950s, measuring 2,065 days through yesterday (Sep. 13). The longest in the run profiled in the chart: the 10-year run (2,528 days) through Mar. 31, 2001 (green line).
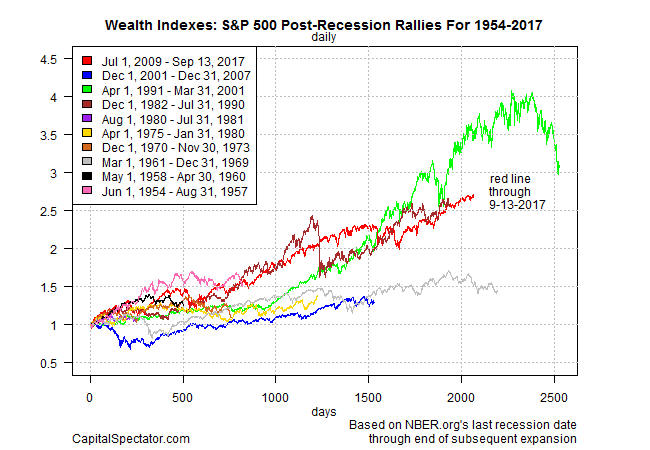
In terms of performance, the current rally is in second place. A $1 investment in the S&P 500 on the first day after the last recession ended (July 1, 2009) has climbed to $2.72 at yesterday’s close. Only the 1991-2001 bull market delivered a greater return: a $1 investment during that period increased to $3.09 by the time the next recession started. Keep in mind that the 1991-2001 had the benefit of a longer run vs. the current bull market.


Leave A Comment