The past 18 months have been difficult for precious metals investors. If you had known Donald Trump would be elected and the US Dollar would soon begin a nearly 15% decline, you would have expected Gold to blow past its 2016 high. You would have been shocked to see the gold miners and junior gold stocks trading lower. Gold has fared okay but the gold stocks and Silver have lagged. As US equities have continued to power higher, precious metals have struggled to perform while volatility in the space has dwindled. Precious metals volatility has reached extremely low levels and this is a sign that a major move, while not necessarily imminent is surely on the horizon.
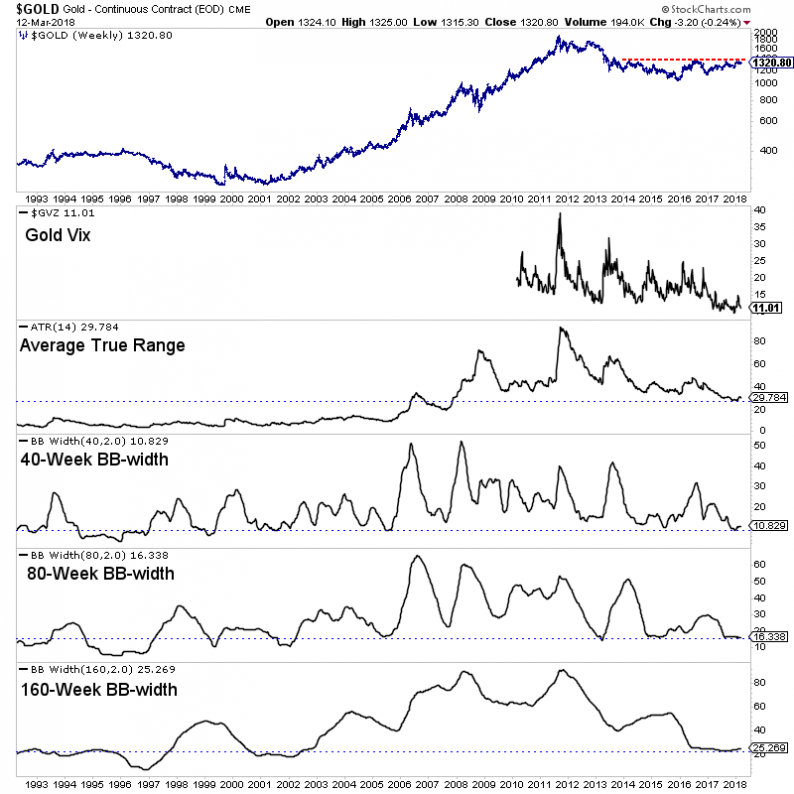
We plot a weekly bar chart of Gold that includes a handful of volatility indicators such as the Gold Vix (GVZ), Average True Range (ATR) and several bollinger band widths (BBw). These indicators have touched major lows in recent months. The Gold Vix which began trading in 2010 recently touched its lowest level ever at 9. ATR recently touched its lowest level since 2007. The 40-week and 80-week BBw’s recently hit their lowest levels since 2005 while the 160-week BBw recently touched its lowest level since 2002.

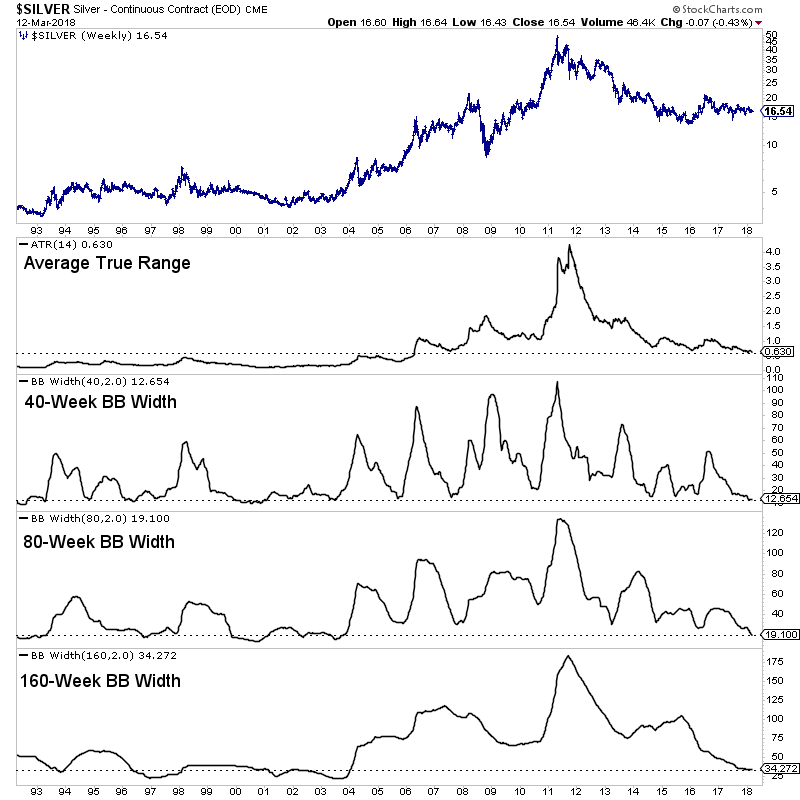
Like Gold, Silver is showing significantly low levels of long-term volatility. Its ATR recently touched its lowest point since 2006. The BBw for three time frames (40 week, 80-week and 160-week) recently touched 14 year lows.
Although the gold stocks are one of the most naturally volatile markets, they too are showing significantly low long-term volatility. Below we plot the NYSE Gold Miners Index, which is the parent index of GDX along with similar volatility indicators. The ATR indicator recently touched a 15 year low. Interestingly, both the 40-week and 80-week BBw’s recently hit some of the lowest points of the past 25 years. The 40-week BBw recently tied 2007 for the lowest point in the past 25 years while the 80-week BBw recently touched a 6-year low and its 3rd lowest point of the past 25 years.


Leave A Comment