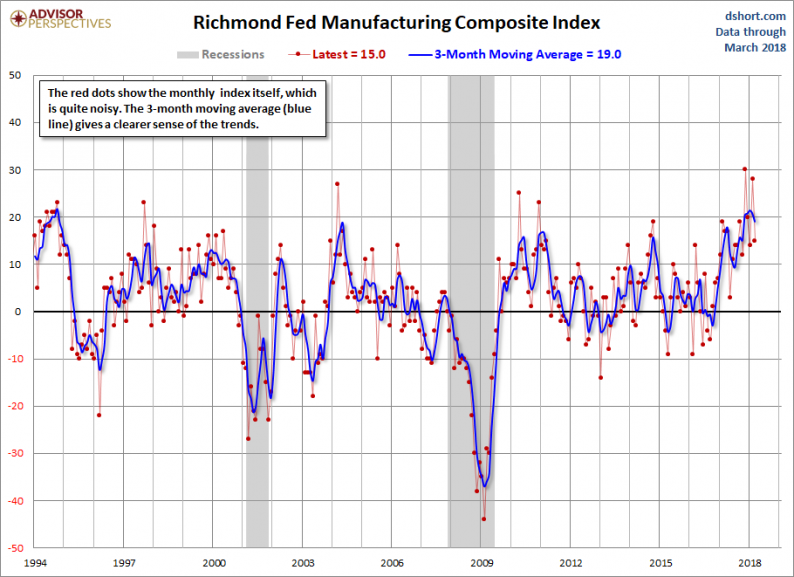
Today the Richmond Fed Manufacturing Composite Index was at 15 for the month of March, down from last month’s 28. Investing.com had forecast 23. Because of the highly volatile nature of this index, we include a 3-month moving average to facilitate the identification of trends, now at 19.0, which indicates expansion. The complete data series behind today’s Richmond Fed manufacturing report, which dates from November 1993, is available here.
Here is a snapshot of the complete Richmond Fed Manufacturing Composite series.
Here is the latest Richmond Fed manufacturing overview.
Fifth District manufacturing expanded at a slower pace in March, according to the most recent survey results from the Federal Reserve Bank of Richmond. The composite index dropped from a particularly strong reading of 28 in February to 15 in March as each of the three components (shipments, new orders, and employment) fell. However, for each of these variables, a larger share of firms predicted growth in six months than had in February. Firms reported weaker growth in capital expenditures in March but saw an uptick in growth of business services expenditures. Link to Report
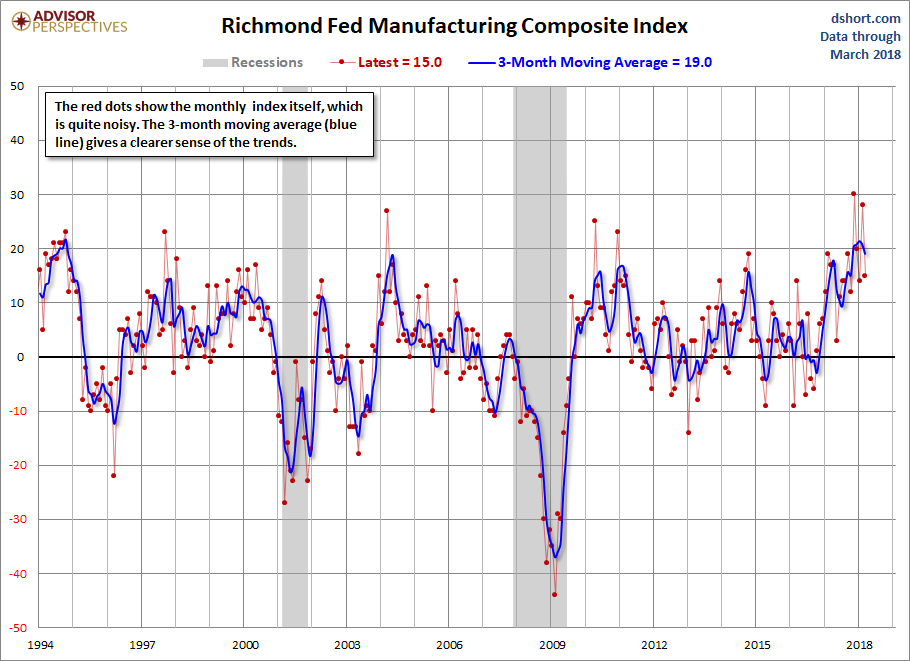
Here is a somewhat closer look at the index since the turn of the century.

Is today’s Richmond composite a clue of what to expect in the next PMI composite? We’ll find out when the next ISM Manufacturing survey is released (below).

Let’s compare all five Regional Manufacturing indicators. Here is a three-month moving average overlay of each since 2001 (for those with data).

Here is the same chart including the average of the five.


Leave A Comment