2017 was one of the least volatile years ever for the US equity market. The S&P 500 averaged an absolute daily change of just 0.30% last year.
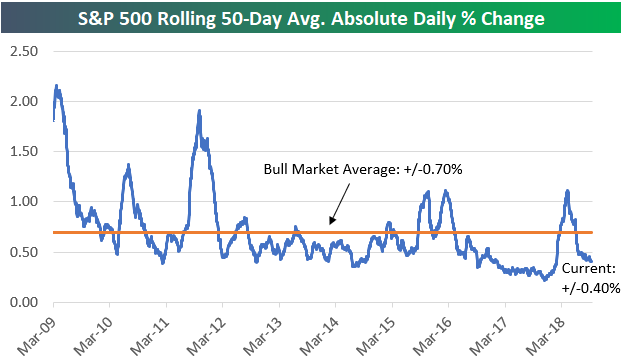
Due to a pick-up in volatility during the S&P’s correction in the first quarter, the average absolute daily change for the index is more elevated this year at +/-0.64%, but more recently we’ve seen a pretty big drop in the action. As shown in the chart below, the S&P has averaged an absolute change of just +/-0.40% over the last 50 trading days, which is well below the average of 0.70% seen throughout the current bull market.
From a seasonal perspective, September and October have historically been the most volatile months of the trading year, but so far this September, the S&P has averaged a daily move of less than 0.24%. It’s starting to feel like 2017 all over again!


Leave A Comment