
Within the context of the 2016 volatility to date, the S&P 500 traded in a relatively narrow range. Following a somewhat weaker than expected unemployment report, the index hit its -0.63% intraday low in the opening minutes and then bounced to its 0.77% intraday high about an hour later. It then fell into the shallow red and oscillated around the flat line until shortly before some action at the close lifted the index to its 0.15% closing gain. Today’s intraday range of 1.41% is close to the 1.45% average since 2007, but quite tame compared to recent volatility — the third smallest intraday range of the 23 market days so far in 2016.
The yield on the 10-year note closed at 1.87%, down 1 basis point from the previous close.
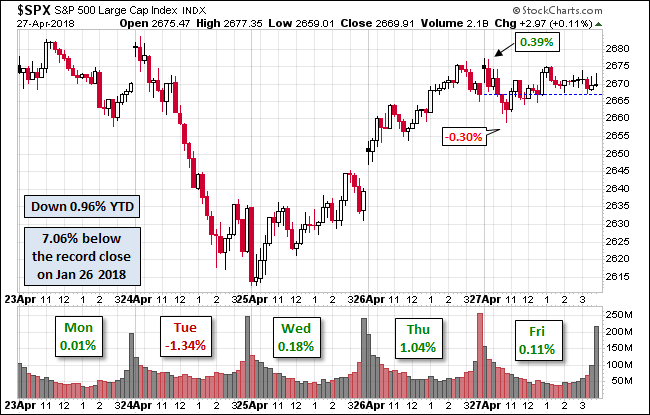
Here is a snapshot of past five sessions.
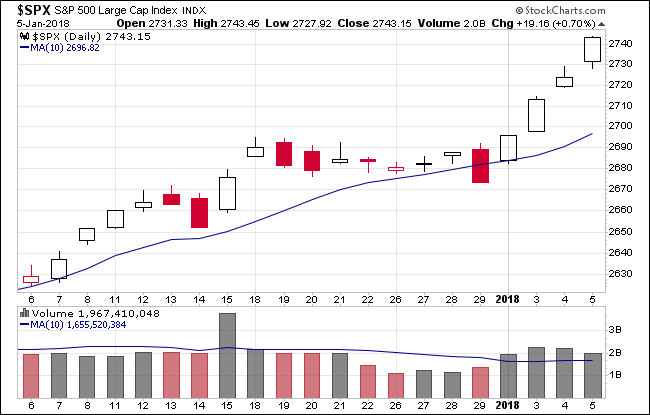
Here is a daily chart of the index. Volume remains elevated.
A Perspective on Drawdowns
Here’s a snapshot of selloffs since the 2009 trough.

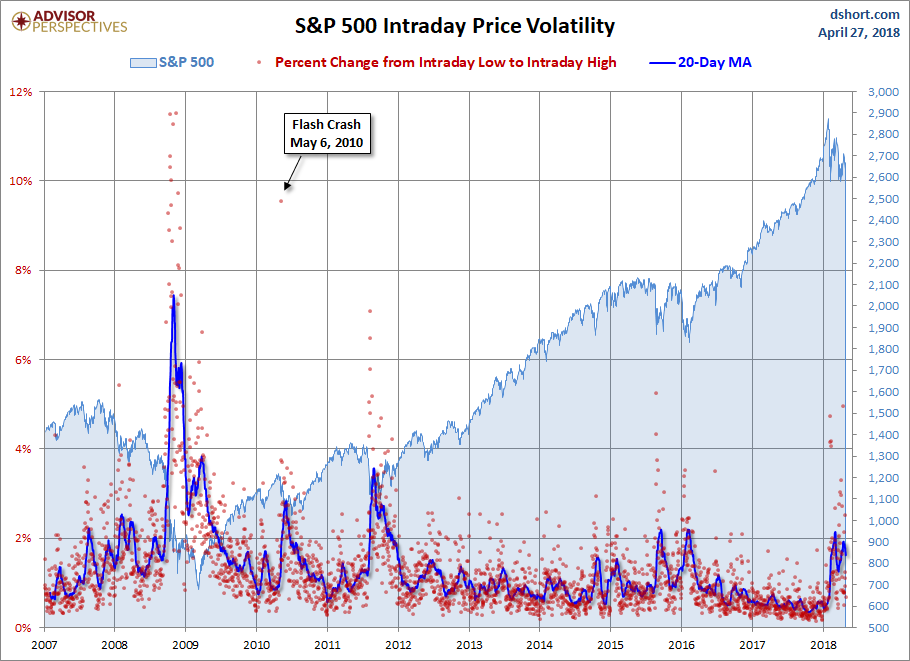
A Perspective on Volatility
For a sense of the correlation between the closing price and intraday volatility, the chart below overlays the S&P 500 since 2007 with the intraday price range. We’ve also included a 20-day moving average to help identify trends in volatility.
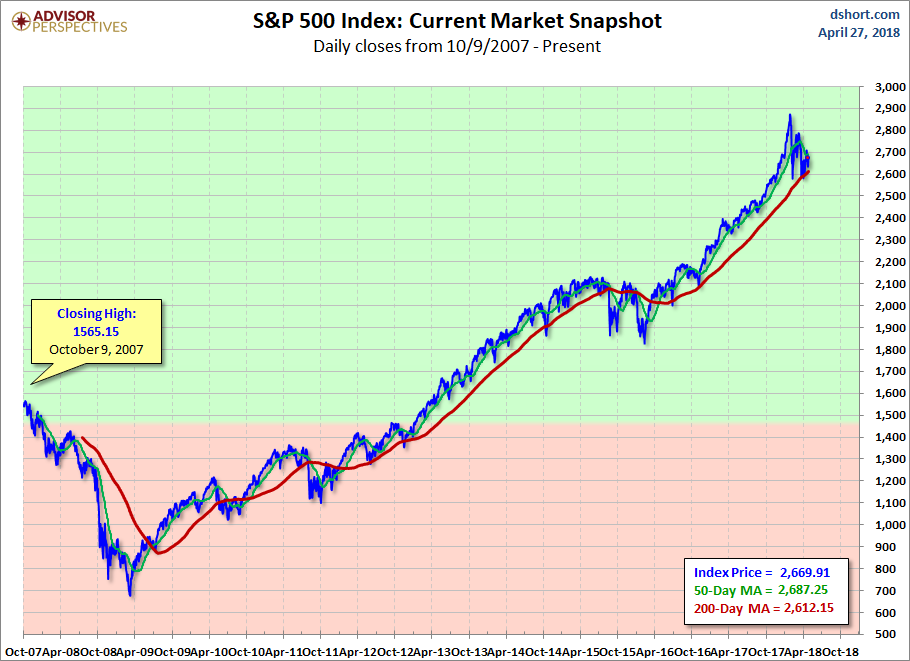
Here is the same chart with the 50- and 200-day moving averages.


Leave A Comment