
We’ve just published a report for Bespoke Premium members titled “The Most Loved and Hated Sectors.” The report looks at the sectors that have the highest percentage of Buy and Sell ratings along with the sectors that have seen the biggest increases or decreases in Buy and Sell ratings over the last six months.
Without breaking down the percentage of Buy and Sell ratings by sector, below we highlight the total number of Buy, Sell, and Hold ratings for S&P 500 stocks. In total there are 11,097 analyst ratings, which equates to 22 analyst ratings per stock. Think that’s a bit excessive?
Of the 11,097 ratings, 5,701 are Buys, 4,850 are Holds, and 546 are Sells. Clearly analysts don’t like slapping a Sell rating on a stock!

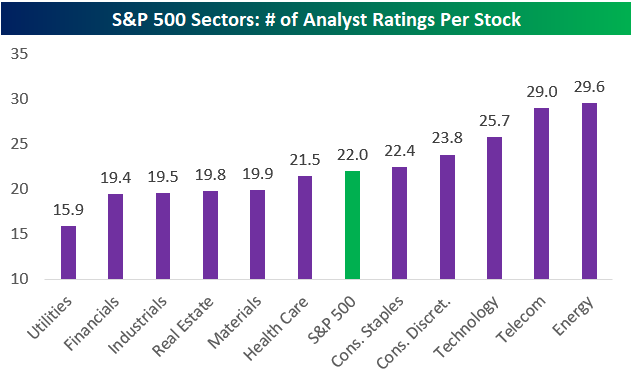
Looking at sectors, you might think that Tech stocks are covered the most by analysts, but that’s not the case. The Energy sector actually has the highest number of analyst ratings per stock at 29.6. Tech ranks third at 25.7, followed by Consumer Discretionary at 23.8.
On the flip side, the Utilities sector — as much fun as it is — has the lowest number of analyst ratings per stock at 15.9.


Leave A Comment